29
/
en
AIzaSyAYiBZKx7MnpbEhh9jyipgxe19OcubqV5w
April 1, 2024
59007
Sub-Saharan Africa
SSF
false
2
1
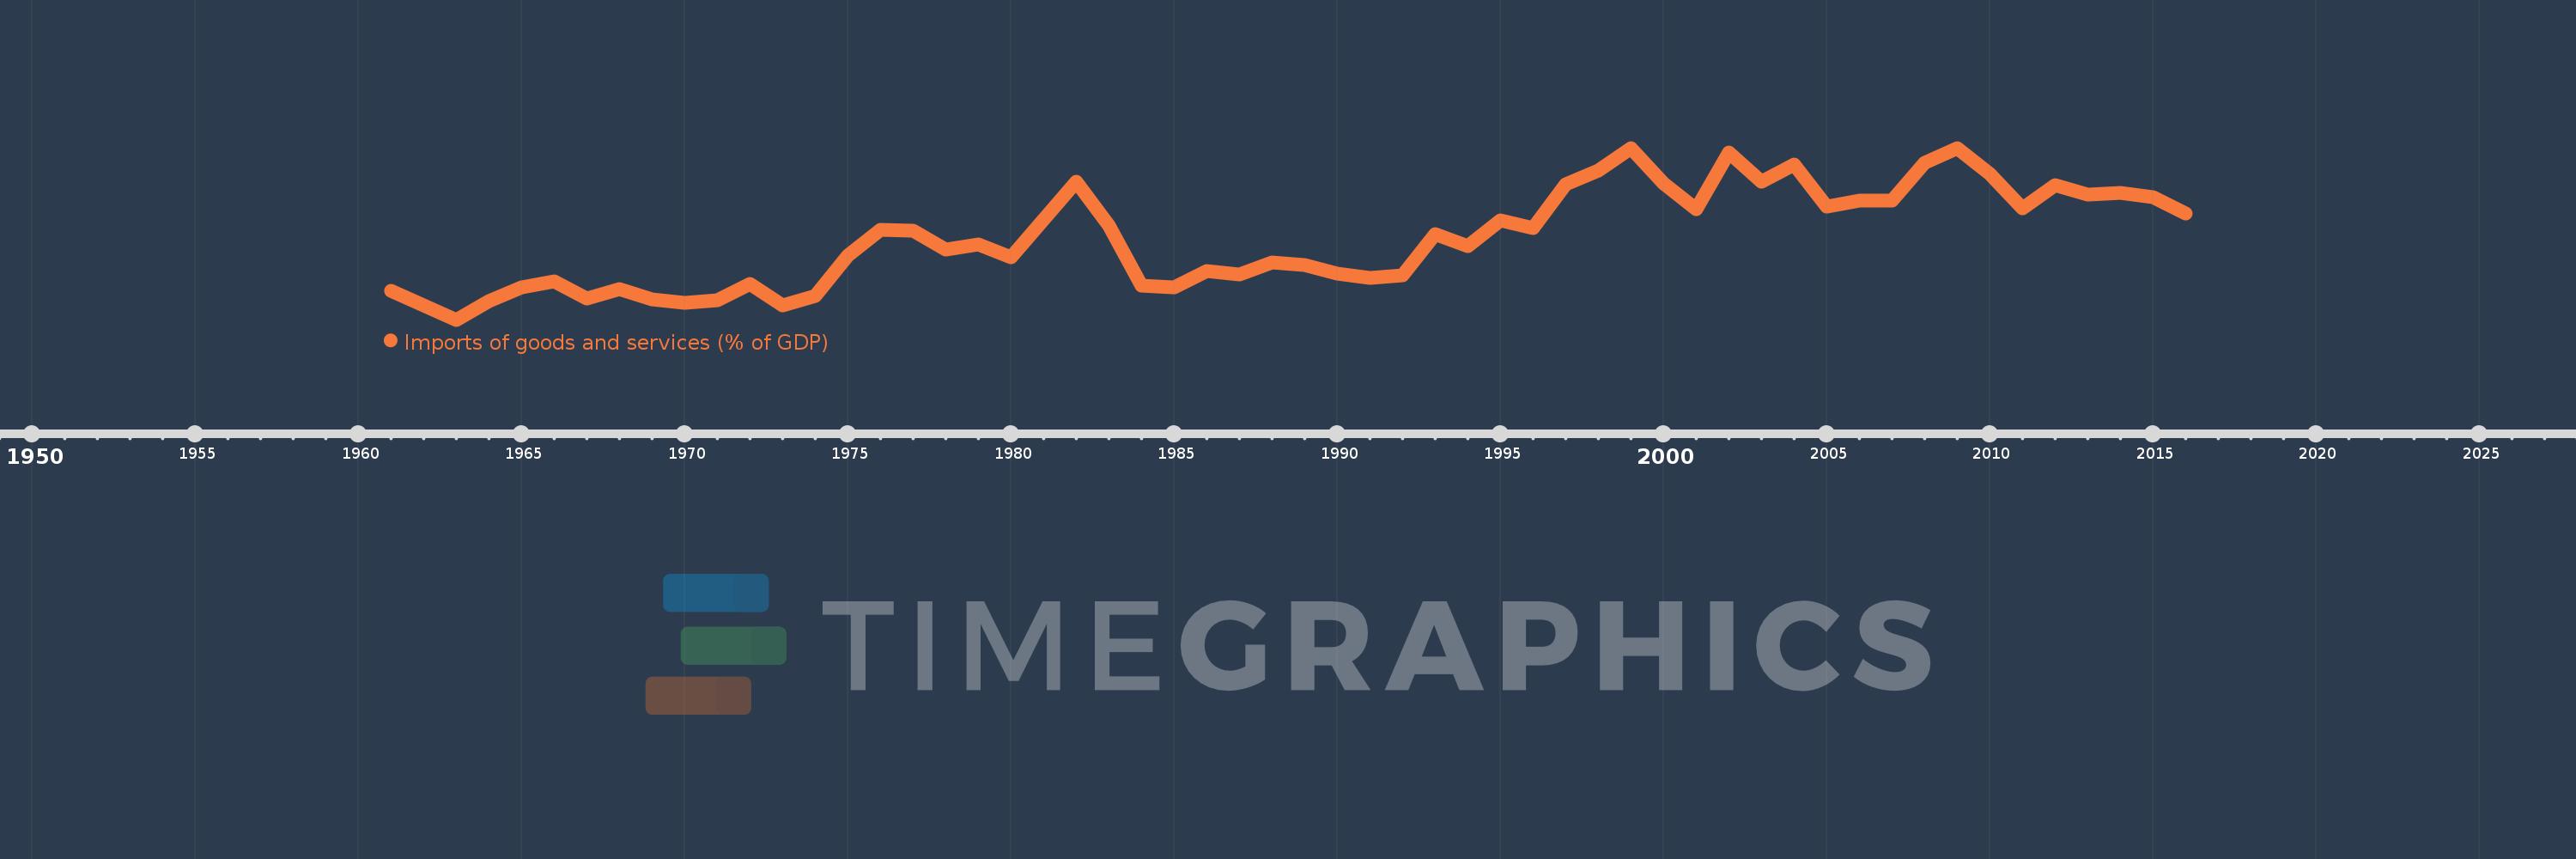
Imports of goods and services (% of GDP)
2016,2015,2014,2013,2012,2011,2010,2009,2008,2007,2006,2005,2004,2003,2002,2001,2000,1999,1998,1997,1996,1995,1994,1993,1992,1991,1990,1989,1988,1987,1986,1985,1984,1983,1982,1981,1980,1979,1978,1977,1976,1975,1974,1973,1972,1971,1970,1969,1968,1967,1966,1965,1964,1963,1962,1961
This statistics in other country:
AfghanistanAlbaniaAlgeriaAngolaAntigua and BarbudaArab WorldArgentinaArmeniaArubaAustraliaAustriaAzerbaijanBahamas, TheBahrainBangladeshBarbadosBelarusBelgiumBelizeBeninBermudaBhutanBoliviaBosnia and HerzegovinaBotswanaBrazilBrunei DarussalamBulgariaBurkina FasoBurundiCabo VerdeCambodiaCameroonCanadaCaribbean small statesCentral African RepublicCentral Europe and the BalticsChadChileChinaColombiaComorosCongo, Dem. Rep.Congo, Rep.Costa RicaCote d'IvoireCroatiaCubaCyprusCzech RepublicDenmarkDjiboutiDominicaDominican RepublicEarly-demographic dividendEast Asia & PacificEast Asia & Pacific (excluding high income)East Asia & Pacific (IDA & IBRD countries)EcuadorEgypt, Arab Rep.El SalvadorEquatorial GuineaEritreaEstoniaEthiopiaEuro areaEurope & Central AsiaEurope & Central Asia (excluding high income)Europe & Central Asia (IDA & IBRD countries)European UnionFaroe IslandsFijiFinlandFragile and conflict affected situationsFranceFrench PolynesiaGabonGambia, TheGeorgiaGermanyGhanaGreeceGrenadaGuatemalaGuineaGuinea-BissauGuyanaHaitiHeavily indebted poor countries (HIPC)High incomeHondurasHong Kong SAR, ChinaHungaryIBRD onlyIcelandIDA & IBRD totalIDA blendIDA onlyIDA totalIndiaIndonesiaIran, Islamic Rep.IraqIrelandIsraelItalyJamaicaJapanJordanKazakhstanKenyaKiribatiKorea, Rep.KosovoKuwaitKyrgyz RepublicLao PDRLate-demographic dividendLatin America & Caribbean Latin America & Caribbean (excluding high income)Latin America & the Caribbean (IDA & IBRD countries)LatviaLeast developed countries: UN classificationLebanonLesothoLiberiaLibyaLithuaniaLow & middle incomeLow incomeLower middle incomeLuxembourgMacao SAR, ChinaMacedonia, FYRMadagascarMalawiMalaysiaMaldivesMaliMaltaMauritaniaMauritiusMexicoMicronesia, Fed. Sts.Middle East & North AfricaMiddle East & North Africa (excluding high income)Middle East & North Africa (IDA & IBRD countries)Middle incomeMoldovaMongoliaMontenegroMoroccoMozambiqueMyanmarNamibiaNepalNetherlandsNew CaledoniaNew ZealandNicaraguaNigerNigeriaNorth AmericaNorwayOECD membersOmanOther small statesPacific island small statesPakistanPalauPanamaPapua New GuineaParaguayPeruPhilippinesPolandPortugalPost-demographic dividendPre-demographic dividendPuerto RicoQatarRomaniaRussian FederationRwandaSamoaSaudi ArabiaSenegalSerbiaSeychellesSierra LeoneSingaporeSlovak RepublicSloveniaSmall statesSolomon IslandsSomaliaSouth AfricaSouth AsiaSouth Asia (IDA & IBRD)South SudanSpainSri LankaSt. Kitts and NevisSt. LuciaSt. Vincent and the GrenadinesSub-Saharan Africa Sub-Saharan Africa (excluding high income)Sub-Saharan Africa (IDA & IBRD countries)SudanSurinameSwazilandSwedenSwitzerlandSyrian Arab RepublicTajikistanTanzaniaThailandTimor-LesteTogoTongaTrinidad and TobagoTunisiaTurkeyTurkmenistanUgandaUkraineUnited Arab EmiratesUnited KingdomUnited StatesUpper middle incomeUruguayUzbekistanVanuatuVenezuela, RBVietnamWest Bank and GazaWorldYemen, Rep.ZambiaZimbabwe Timeline:
This timeline shows a graph from 1961 to 2016 of Sub-Saharan Africa . No data until 1960. Number of actual observations by date: 56.
Source name:
World Development Indicators
Source organization:
World Bank national accounts data, and OECD National Accounts data files.
Categories, topics:
Economy & Growth, Trade
Last updated:
apr 23, 2017
Indicators value changes by year
Maximum:
36.034
jan 1, 1999
At the date of observation
Value
Absolute change
Change from previous value
jan 1, 1961
23.007
+23.007
0.0%
jan 1, 1962
21.685
-1.322
-5.75%
jan 1, 1963
20.41
-1.275
-5.88%
jan 1, 1964
22.101
+1.691
8.29%
jan 1, 1965
23.366
+1.265
5.72%
jan 1, 1966
23.926
+0.56
2.4%
jan 1, 1967
22.367
-1.559
-6.52%
jan 1, 1968
23.237
+0.87
3.89%
jan 1, 1969
22.239
-0.998
-4.3%
jan 1, 1970
21.926
-0.313
-1.41%
jan 1, 1971
22.204
+0.278
1.27%
jan 1, 1972
23.653
+1.449
6.53%
jan 1, 1973
21.717
-1.937
-8.19%
jan 1, 1974
22.561
+0.844
3.89%
jan 1, 1975
26.225
+3.664
16.24%
jan 1, 1976
28.569
+2.343
8.94%
jan 1, 1977
28.507
-0.061
-0.21%
jan 1, 1978
26.765
-1.742
-6.11%
jan 1, 1979
27.225
+0.46
1.72%
jan 1, 1980
26.084
-1.142
-4.19%
jan 1, 1981
29.549
+3.466
13.29%
jan 1, 1982
32.973
+3.423
11.59%
jan 1, 1983
28.982
-3.99
-12.1%
jan 1, 1984
23.55
-5.433
-18.74%
jan 1, 1985
23.384
-0.165
-0.7%
jan 1, 1986
24.804
+1.42
6.07%
jan 1, 1987
24.51
-0.294
-1.19%
jan 1, 1988
25.611
+1.102
4.49%
jan 1, 1989
25.425
-0.186
-0.73%
jan 1, 1990
24.599
-0.826
-3.25%
jan 1, 1991
24.239
-0.36
-1.46%
jan 1, 1992
24.439
+0.2
0.82%
jan 1, 1993
28.235
+3.797
15.54%
jan 1, 1994
27.075
-1.16
-4.11%
jan 1, 1995
29.467
+2.391
8.83%
jan 1, 1996
28.738
-0.729
-2.47%
jan 1, 1997
32.766
+4.028
14.02%
jan 1, 1998
34.002
+1.236
3.77%
jan 1, 1999
36.034
+2.031
5.97%
jan 1, 2000
32.808
-3.226
-8.95%
jan 1, 2001
30.496
-2.311
-7.04%
jan 1, 2002
35.639
+5.143
16.86%
jan 1, 2003
32.974
-2.666
-7.48%
jan 1, 2004
34.503
+1.53
4.64%
jan 1, 2005
30.736
-3.767
-10.92%
jan 1, 2006
31.264
+0.527
1.72%
jan 1, 2007
31.234
-0.029
-0.09%
jan 1, 2008
34.715
+3.481
11.14%
jan 1, 2009
36.01
+1.294
3.73%
jan 1, 2010
33.669
-2.34
-6.5%
jan 1, 2011
30.528
-3.141
-9.33%
jan 1, 2012
32.678
+2.15
7.04%
jan 1, 2013
31.777
-0.901
-2.76%
jan 1, 2014
31.943
+0.166
0.52%
jan 1, 2015
31.568
-0.376
-1.18%
jan 1, 2016
30.066
-1.502
-4.76%
Ranking of countries by current statistics by years


Comments: