29
/
en
AIzaSyAYiBZKx7MnpbEhh9jyipgxe19OcubqV5w
April 1, 2024
121046
Dominica
DMA
true
2
1
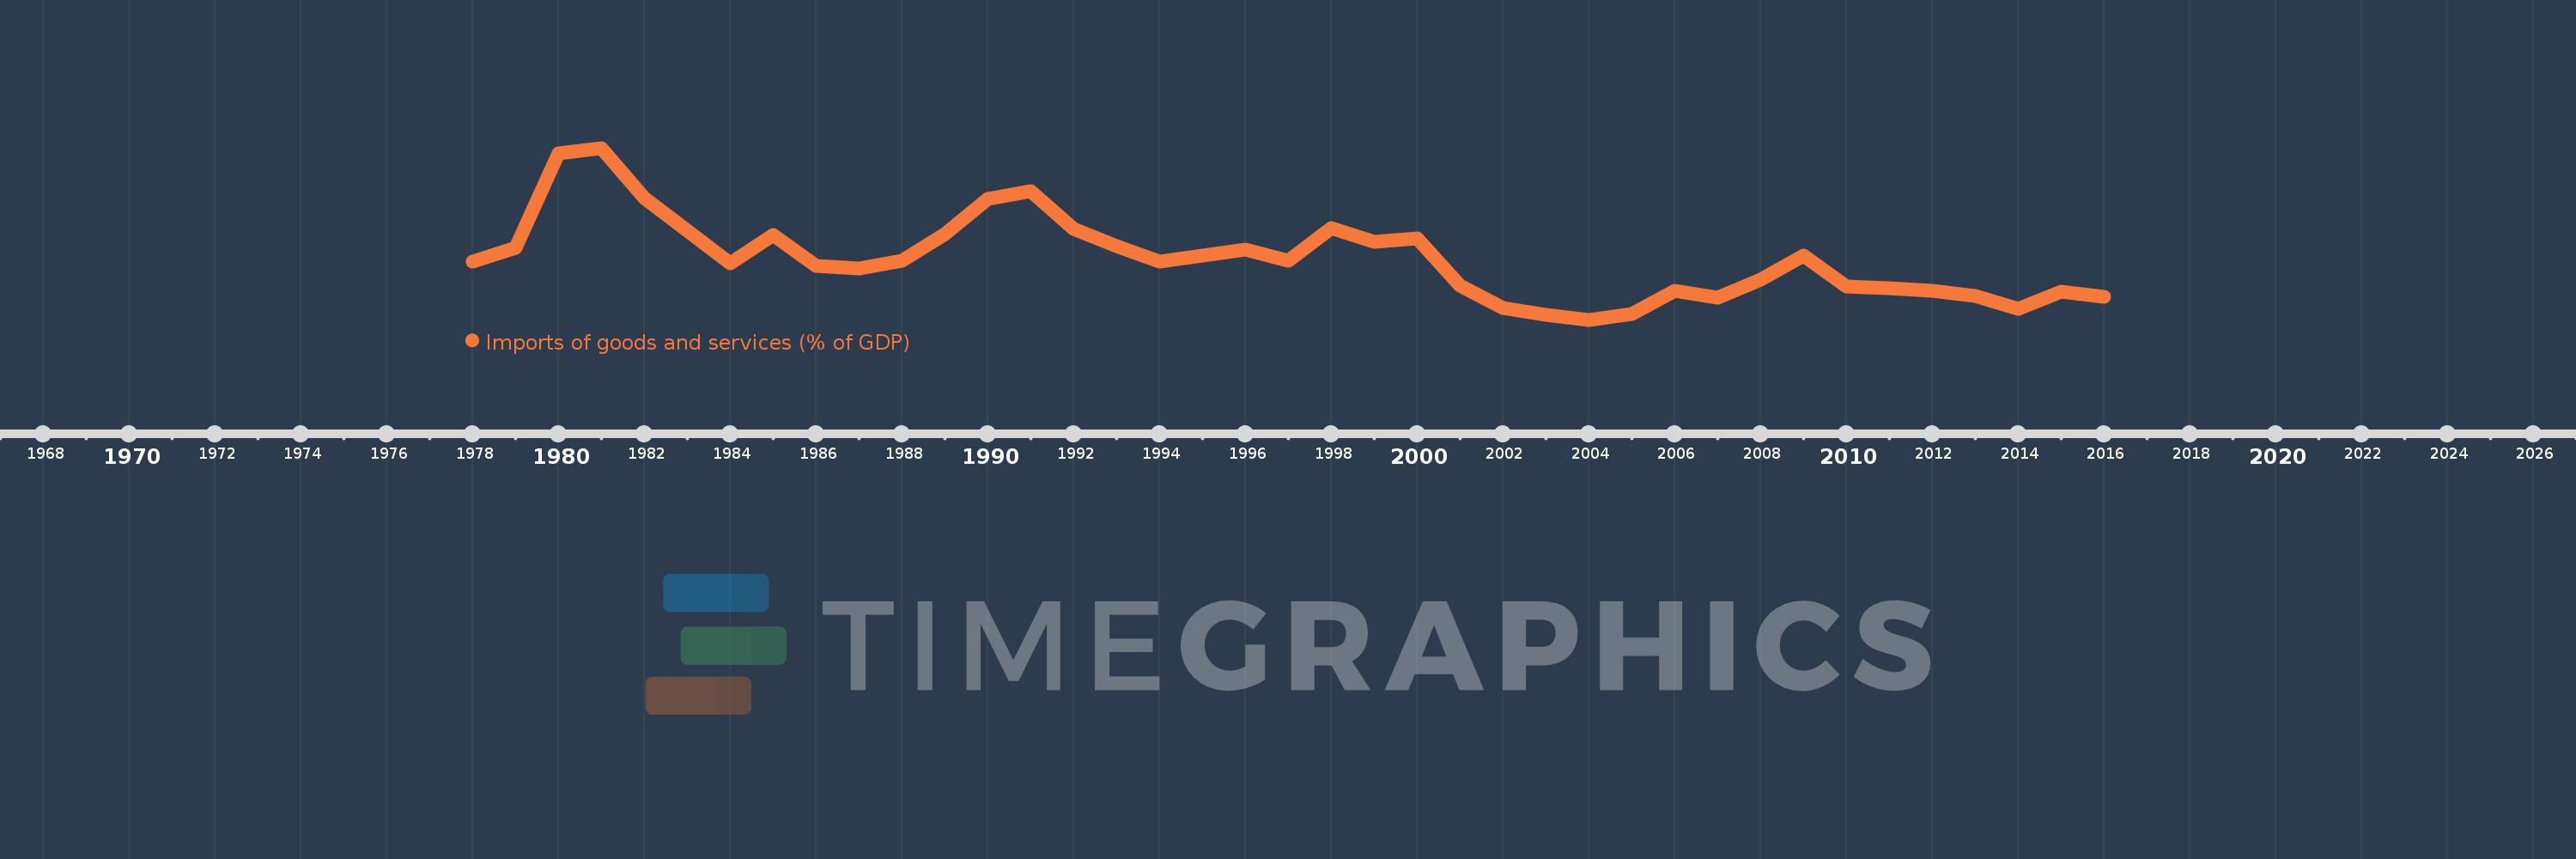
Imports of goods and services (% of GDP)
2016,2015,2014,2013,2012,2011,2010,2009,2008,2007,2006,2005,2004,2003,2002,2001,2000,1999,1998,1997,1996,1995,1994,1993,1992,1991,1990,1989,1988,1987,1986,1985,1984,1983,1982,1981,1980,1979,1978
This statistics in other country:
AfghanistanAlbaniaAlgeriaAngolaAntigua and BarbudaArab WorldArgentinaArmeniaArubaAustraliaAustriaAzerbaijanBahamas, TheBahrainBangladeshBarbadosBelarusBelgiumBelizeBeninBermudaBhutanBoliviaBosnia and HerzegovinaBotswanaBrazilBrunei DarussalamBulgariaBurkina FasoBurundiCabo VerdeCambodiaCameroonCanadaCaribbean small statesCentral African RepublicCentral Europe and the BalticsChadChileChinaColombiaComorosCongo, Dem. Rep.Congo, Rep.Costa RicaCote d'IvoireCroatiaCubaCyprusCzech RepublicDenmarkDjiboutiDominicaDominican RepublicEarly-demographic dividendEast Asia & PacificEast Asia & Pacific (excluding high income)East Asia & Pacific (IDA & IBRD countries)EcuadorEgypt, Arab Rep.El SalvadorEquatorial GuineaEritreaEstoniaEthiopiaEuro areaEurope & Central AsiaEurope & Central Asia (excluding high income)Europe & Central Asia (IDA & IBRD countries)European UnionFaroe IslandsFijiFinlandFragile and conflict affected situationsFranceFrench PolynesiaGabonGambia, TheGeorgiaGermanyGhanaGreeceGrenadaGuatemalaGuineaGuinea-BissauGuyanaHaitiHeavily indebted poor countries (HIPC)High incomeHondurasHong Kong SAR, ChinaHungaryIBRD onlyIcelandIDA & IBRD totalIDA blendIDA onlyIDA totalIndiaIndonesiaIran, Islamic Rep.IraqIrelandIsraelItalyJamaicaJapanJordanKazakhstanKenyaKiribatiKorea, Rep.KosovoKuwaitKyrgyz RepublicLao PDRLate-demographic dividendLatin America & Caribbean Latin America & Caribbean (excluding high income)Latin America & the Caribbean (IDA & IBRD countries)LatviaLeast developed countries: UN classificationLebanonLesothoLiberiaLibyaLithuaniaLow & middle incomeLow incomeLower middle incomeLuxembourgMacao SAR, ChinaMacedonia, FYRMadagascarMalawiMalaysiaMaldivesMaliMaltaMauritaniaMauritiusMexicoMicronesia, Fed. Sts.Middle East & North AfricaMiddle East & North Africa (excluding high income)Middle East & North Africa (IDA & IBRD countries)Middle incomeMoldovaMongoliaMontenegroMoroccoMozambiqueMyanmarNamibiaNepalNetherlandsNew CaledoniaNew ZealandNicaraguaNigerNigeriaNorth AmericaNorwayOECD membersOmanOther small statesPacific island small statesPakistanPalauPanamaPapua New GuineaParaguayPeruPhilippinesPolandPortugalPost-demographic dividendPre-demographic dividendPuerto RicoQatarRomaniaRussian FederationRwandaSamoaSaudi ArabiaSenegalSerbiaSeychellesSierra LeoneSingaporeSlovak RepublicSloveniaSmall statesSolomon IslandsSomaliaSouth AfricaSouth AsiaSouth Asia (IDA & IBRD)South SudanSpainSri LankaSt. Kitts and NevisSt. LuciaSt. Vincent and the GrenadinesSub-Saharan Africa Sub-Saharan Africa (excluding high income)Sub-Saharan Africa (IDA & IBRD countries)SudanSurinameSwazilandSwedenSwitzerlandSyrian Arab RepublicTajikistanTanzaniaThailandTimor-LesteTogoTongaTrinidad and TobagoTunisiaTurkeyTurkmenistanUgandaUkraineUnited Arab EmiratesUnited KingdomUnited StatesUpper middle incomeUruguayUzbekistanVanuatuVenezuela, RBVietnamWest Bank and GazaWorldYemen, Rep.ZambiaZimbabwe Timeline:
This timeline shows a graph from 1978 to 2016 of Dominica. No data until 1977. Number of actual observations by date: 39.
Source name:
World Development Indicators
Source organization:
World Bank national accounts data, and OECD National Accounts data files.
Categories, topics:
Economy & Growth, Trade
Last updated:
apr 23, 2017
Indicators value changes by year
Minimum:
44.942
jan 1, 2004
Maximum:
92.561
jan 1, 1981
At the date of observation
Value
Absolute change
Change from previous value
jan 1, 1978
60.998
+60.998
0.0%
jan 1, 1979
64.857
+3.859
6.33%
jan 1, 1980
90.97
+26.113
40.26%
jan 1, 1981
92.561
+1.591
1.75%
jan 1, 1982
78.696
-13.866
-14.98%
jan 1, 1983
69.549
-9.147
-11.62%
jan 1, 1984
60.565
-8.983
-12.92%
jan 1, 1985
68.387
+7.822
12.91%
jan 1, 1986
59.952
-8.435
-12.33%
jan 1, 1987
59.217
-0.735
-1.23%
jan 1, 1988
61.338
+2.122
3.58%
jan 1, 1989
68.784
+7.446
12.14%
jan 1, 1990
78.409
+9.625
13.99%
jan 1, 1991
80.535
+2.126
2.71%
jan 1, 1992
70.007
-10.528
-13.07%
jan 1, 1993
65.304
-4.703
-6.72%
jan 1, 1994
61.015
-4.289
-6.57%
jan 1, 1995
62.796
+1.781
2.92%
jan 1, 1996
64.409
+1.613
2.57%
jan 1, 1997
61.367
-3.042
-4.72%
jan 1, 1998
70.327
+8.96
14.6%
jan 1, 1999
66.625
-3.703
-5.27%
jan 1, 2000
67.451
+0.826
1.24%
jan 1, 2001
54.512
-12.938
-19.18%
jan 1, 2002
48.306
-6.206
-11.38%
jan 1, 2003
46.265
-2.042
-4.23%
jan 1, 2004
44.942
-1.323
-2.86%
jan 1, 2005
46.458
+1.516
3.37%
jan 1, 2006
53.0
+6.542
14.08%
jan 1, 2007
50.949
-2.051
-3.87%
jan 1, 2008
56.086
+5.137
10.08%
jan 1, 2009
62.708
+6.622
11.81%
jan 1, 2010
54.075
-8.633
-13.77%
jan 1, 2011
53.565
-0.509
-0.94%
jan 1, 2012
52.857
-0.708
-1.32%
jan 1, 2013
51.425
-1.432
-2.71%
jan 1, 2014
47.923
-3.502
-6.81%
jan 1, 2015
52.652
+4.729
9.87%
jan 1, 2016
51.278
-1.373
-2.61%
Ranking of countries by current statistics by years


Comments: