29
/
en
AIzaSyAYiBZKx7MnpbEhh9jyipgxe19OcubqV5w
April 1, 2024
139384
Germany
DEU
true
2
1
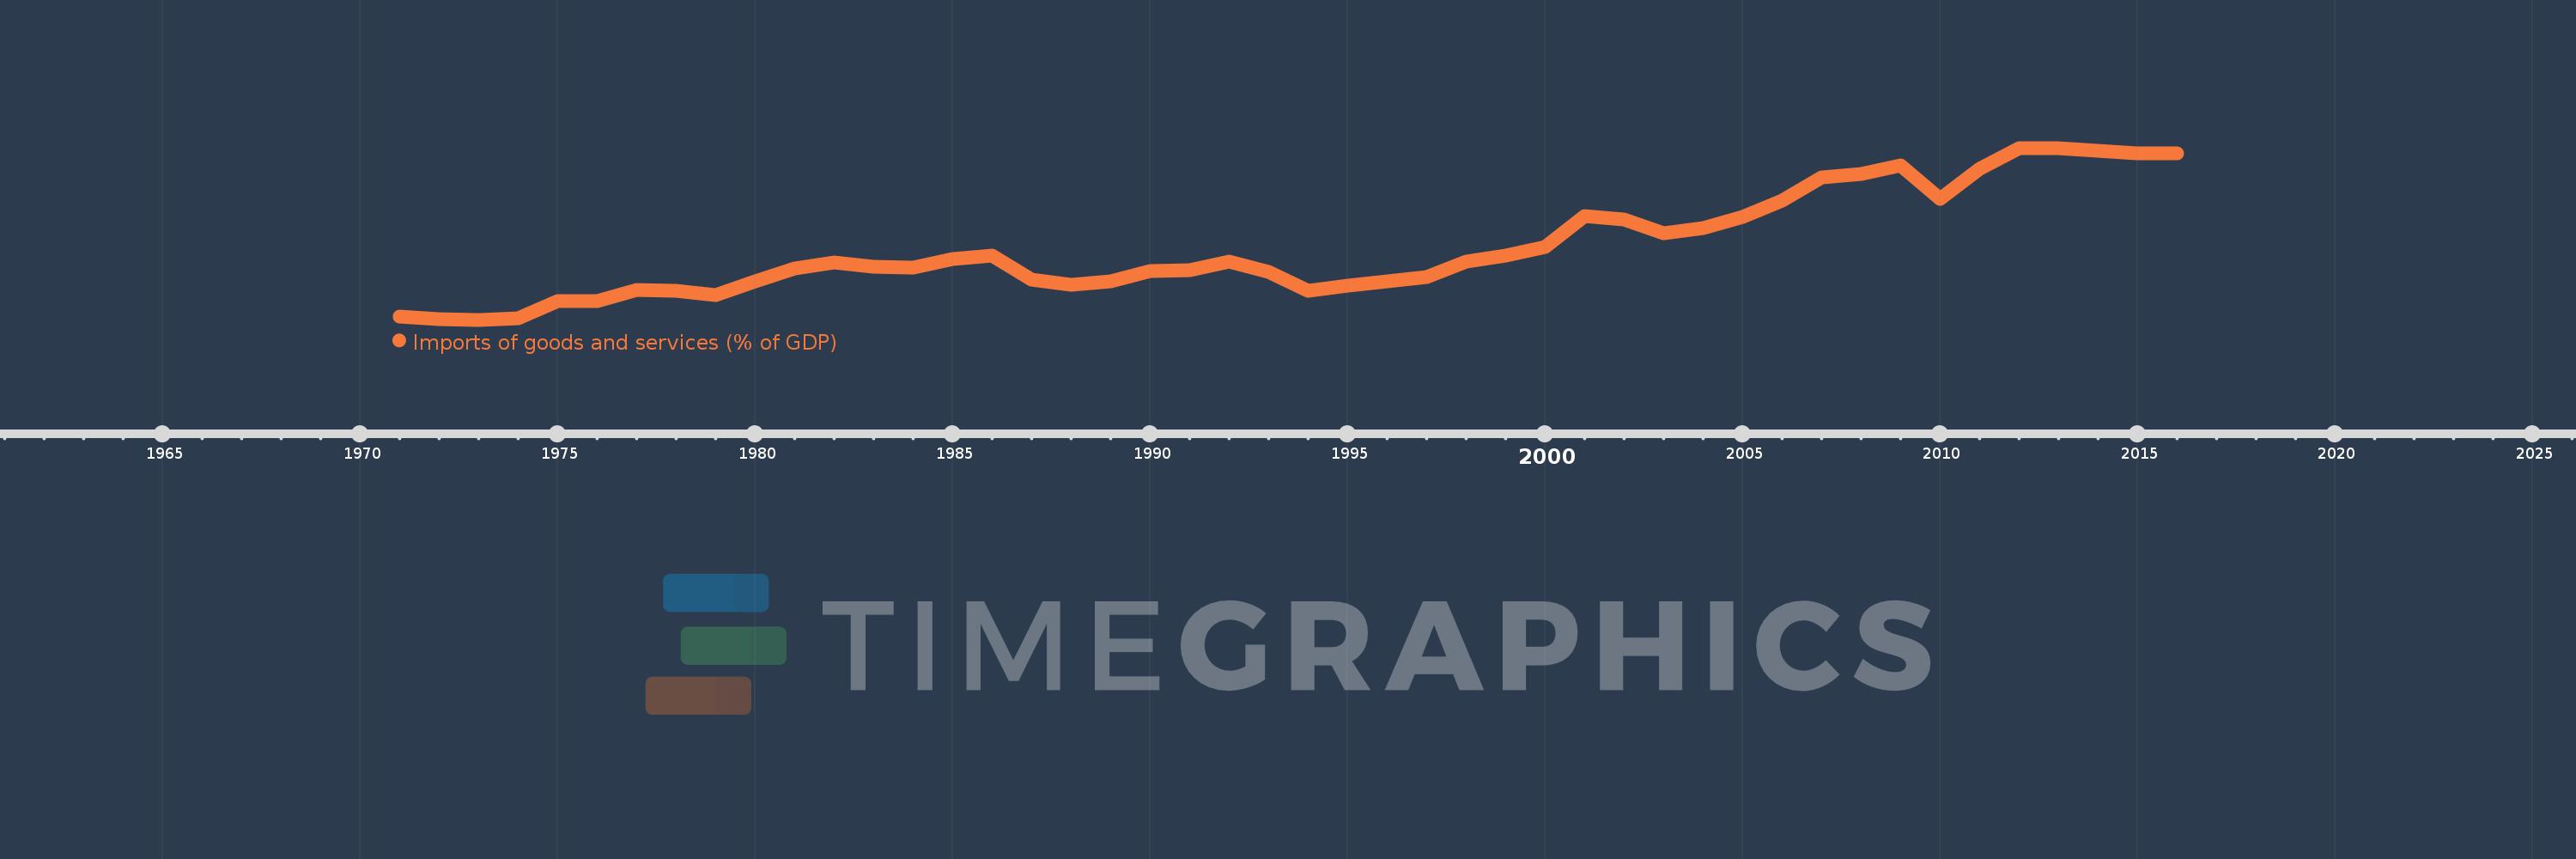
Imports of goods and services (% of GDP)
2016,2015,2014,2013,2012,2011,2010,2009,2008,2007,2006,2005,2004,2003,2002,2001,2000,1999,1998,1997,1996,1995,1994,1993,1992,1991,1990,1989,1988,1987,1986,1985,1984,1983,1982,1981,1980,1979,1978,1977,1976,1975,1974,1973,1972,1971
This statistics in other country:
AfghanistanAlbaniaAlgeriaAngolaAntigua and BarbudaArab WorldArgentinaArmeniaArubaAustraliaAustriaAzerbaijanBahamas, TheBahrainBangladeshBarbadosBelarusBelgiumBelizeBeninBermudaBhutanBoliviaBosnia and HerzegovinaBotswanaBrazilBrunei DarussalamBulgariaBurkina FasoBurundiCabo VerdeCambodiaCameroonCanadaCaribbean small statesCentral African RepublicCentral Europe and the BalticsChadChileChinaColombiaComorosCongo, Dem. Rep.Congo, Rep.Costa RicaCote d'IvoireCroatiaCubaCyprusCzech RepublicDenmarkDjiboutiDominicaDominican RepublicEarly-demographic dividendEast Asia & PacificEast Asia & Pacific (excluding high income)East Asia & Pacific (IDA & IBRD countries)EcuadorEgypt, Arab Rep.El SalvadorEquatorial GuineaEritreaEstoniaEthiopiaEuro areaEurope & Central AsiaEurope & Central Asia (excluding high income)Europe & Central Asia (IDA & IBRD countries)European UnionFaroe IslandsFijiFinlandFragile and conflict affected situationsFranceFrench PolynesiaGabonGambia, TheGeorgiaGermanyGhanaGreeceGrenadaGuatemalaGuineaGuinea-BissauGuyanaHaitiHeavily indebted poor countries (HIPC)High incomeHondurasHong Kong SAR, ChinaHungaryIBRD onlyIcelandIDA & IBRD totalIDA blendIDA onlyIDA totalIndiaIndonesiaIran, Islamic Rep.IraqIrelandIsraelItalyJamaicaJapanJordanKazakhstanKenyaKiribatiKorea, Rep.KosovoKuwaitKyrgyz RepublicLao PDRLate-demographic dividendLatin America & Caribbean Latin America & Caribbean (excluding high income)Latin America & the Caribbean (IDA & IBRD countries)LatviaLeast developed countries: UN classificationLebanonLesothoLiberiaLibyaLithuaniaLow & middle incomeLow incomeLower middle incomeLuxembourgMacao SAR, ChinaMacedonia, FYRMadagascarMalawiMalaysiaMaldivesMaliMaltaMauritaniaMauritiusMexicoMicronesia, Fed. Sts.Middle East & North AfricaMiddle East & North Africa (excluding high income)Middle East & North Africa (IDA & IBRD countries)Middle incomeMoldovaMongoliaMontenegroMoroccoMozambiqueMyanmarNamibiaNepalNetherlandsNew CaledoniaNew ZealandNicaraguaNigerNigeriaNorth AmericaNorwayOECD membersOmanOther small statesPacific island small statesPakistanPalauPanamaPapua New GuineaParaguayPeruPhilippinesPolandPortugalPost-demographic dividendPre-demographic dividendPuerto RicoQatarRomaniaRussian FederationRwandaSamoaSaudi ArabiaSenegalSerbiaSeychellesSierra LeoneSingaporeSlovak RepublicSloveniaSmall statesSolomon IslandsSomaliaSouth AfricaSouth AsiaSouth Asia (IDA & IBRD)South SudanSpainSri LankaSt. Kitts and NevisSt. LuciaSt. Vincent and the GrenadinesSub-Saharan Africa Sub-Saharan Africa (excluding high income)Sub-Saharan Africa (IDA & IBRD countries)SudanSurinameSwazilandSwedenSwitzerlandSyrian Arab RepublicTajikistanTanzaniaThailandTimor-LesteTogoTongaTrinidad and TobagoTunisiaTurkeyTurkmenistanUgandaUkraineUnited Arab EmiratesUnited KingdomUnited StatesUpper middle incomeUruguayUzbekistanVanuatuVenezuela, RBVietnamWest Bank and GazaWorldYemen, Rep.ZambiaZimbabwe Timeline:
This timeline shows a graph from 1971 to 2016 of Germany. No data until 1970. Number of actual observations by date: 46.
Source name:
World Development Indicators
Source organization:
World Bank national accounts data, and OECD National Accounts data files.
Categories, topics:
Economy & Growth, Trade
Last updated:
apr 23, 2017
Indicators value changes by year
Minimum:
16.241
jan 1, 1973
At the date of observation
Value
Absolute change
Change from previous value
jan 1, 1971
16.646
+16.646
0.0%
jan 1, 1972
16.346
-0.3
-1.8%
jan 1, 1973
16.241
-0.104
-0.64%
jan 1, 1974
16.41
+0.169
1.04%
jan 1, 1975
18.787
+2.377
14.48%
jan 1, 1976
18.868
+0.081
0.43%
jan 1, 1977
20.376
+1.508
7.99%
jan 1, 1978
20.201
-0.175
-0.86%
jan 1, 1979
19.618
-0.582
-2.88%
jan 1, 1980
21.482
+1.863
9.5%
jan 1, 1981
23.322
+1.84
8.56%
jan 1, 1982
24.14
+0.819
3.51%
jan 1, 1983
23.608
-0.532
-2.21%
jan 1, 1984
23.373
-0.235
-0.99%
jan 1, 1985
24.611
+1.238
5.3%
jan 1, 1986
25.072
+0.461
1.87%
jan 1, 1987
21.74
-3.332
-13.29%
jan 1, 1988
21.087
-0.654
-3.01%
jan 1, 1989
21.518
+0.432
2.05%
jan 1, 1990
23.004
+1.486
6.9%
jan 1, 1991
23.116
+0.112
0.49%
jan 1, 1992
24.245
+1.129
4.88%
jan 1, 1993
22.786
-1.458
-6.02%
jan 1, 1994
20.29
-2.496
-10.96%
jan 1, 1995
20.938
+0.648
3.19%
jan 1, 1996
21.538
+0.6
2.87%
jan 1, 1997
22.088
+0.55
2.55%
jan 1, 1998
24.209
+2.121
9.6%
jan 1, 1999
25.129
+0.92
3.8%
jan 1, 2000
26.328
+1.199
4.77%
jan 1, 2001
30.56
+4.232
16.07%
jan 1, 2002
30.107
-0.453
-1.48%
jan 1, 2003
28.199
-1.908
-6.34%
jan 1, 2004
28.928
+0.729
2.58%
jan 1, 2005
30.408
+1.48
5.12%
jan 1, 2006
32.681
+2.273
7.48%
jan 1, 2007
35.892
+3.211
9.83%
jan 1, 2008
36.361
+0.469
1.31%
jan 1, 2009
37.485
+1.124
3.09%
jan 1, 2010
32.863
-4.622
-12.33%
jan 1, 2011
37.053
+4.19
12.75%
jan 1, 2012
39.93
+2.877
7.76%
jan 1, 2013
39.892
-0.037
-0.09%
jan 1, 2014
39.5
-0.393
-0.98%
jan 1, 2015
39.129
-0.371
-0.94%
jan 1, 2016
39.213
+0.084
0.21%
Ranking of countries by current statistics by years


Comments: