29
/
en
AIzaSyAYiBZKx7MnpbEhh9jyipgxe19OcubqV5w
April 1, 2024
255300
Swaziland
SWZ
true
2
1
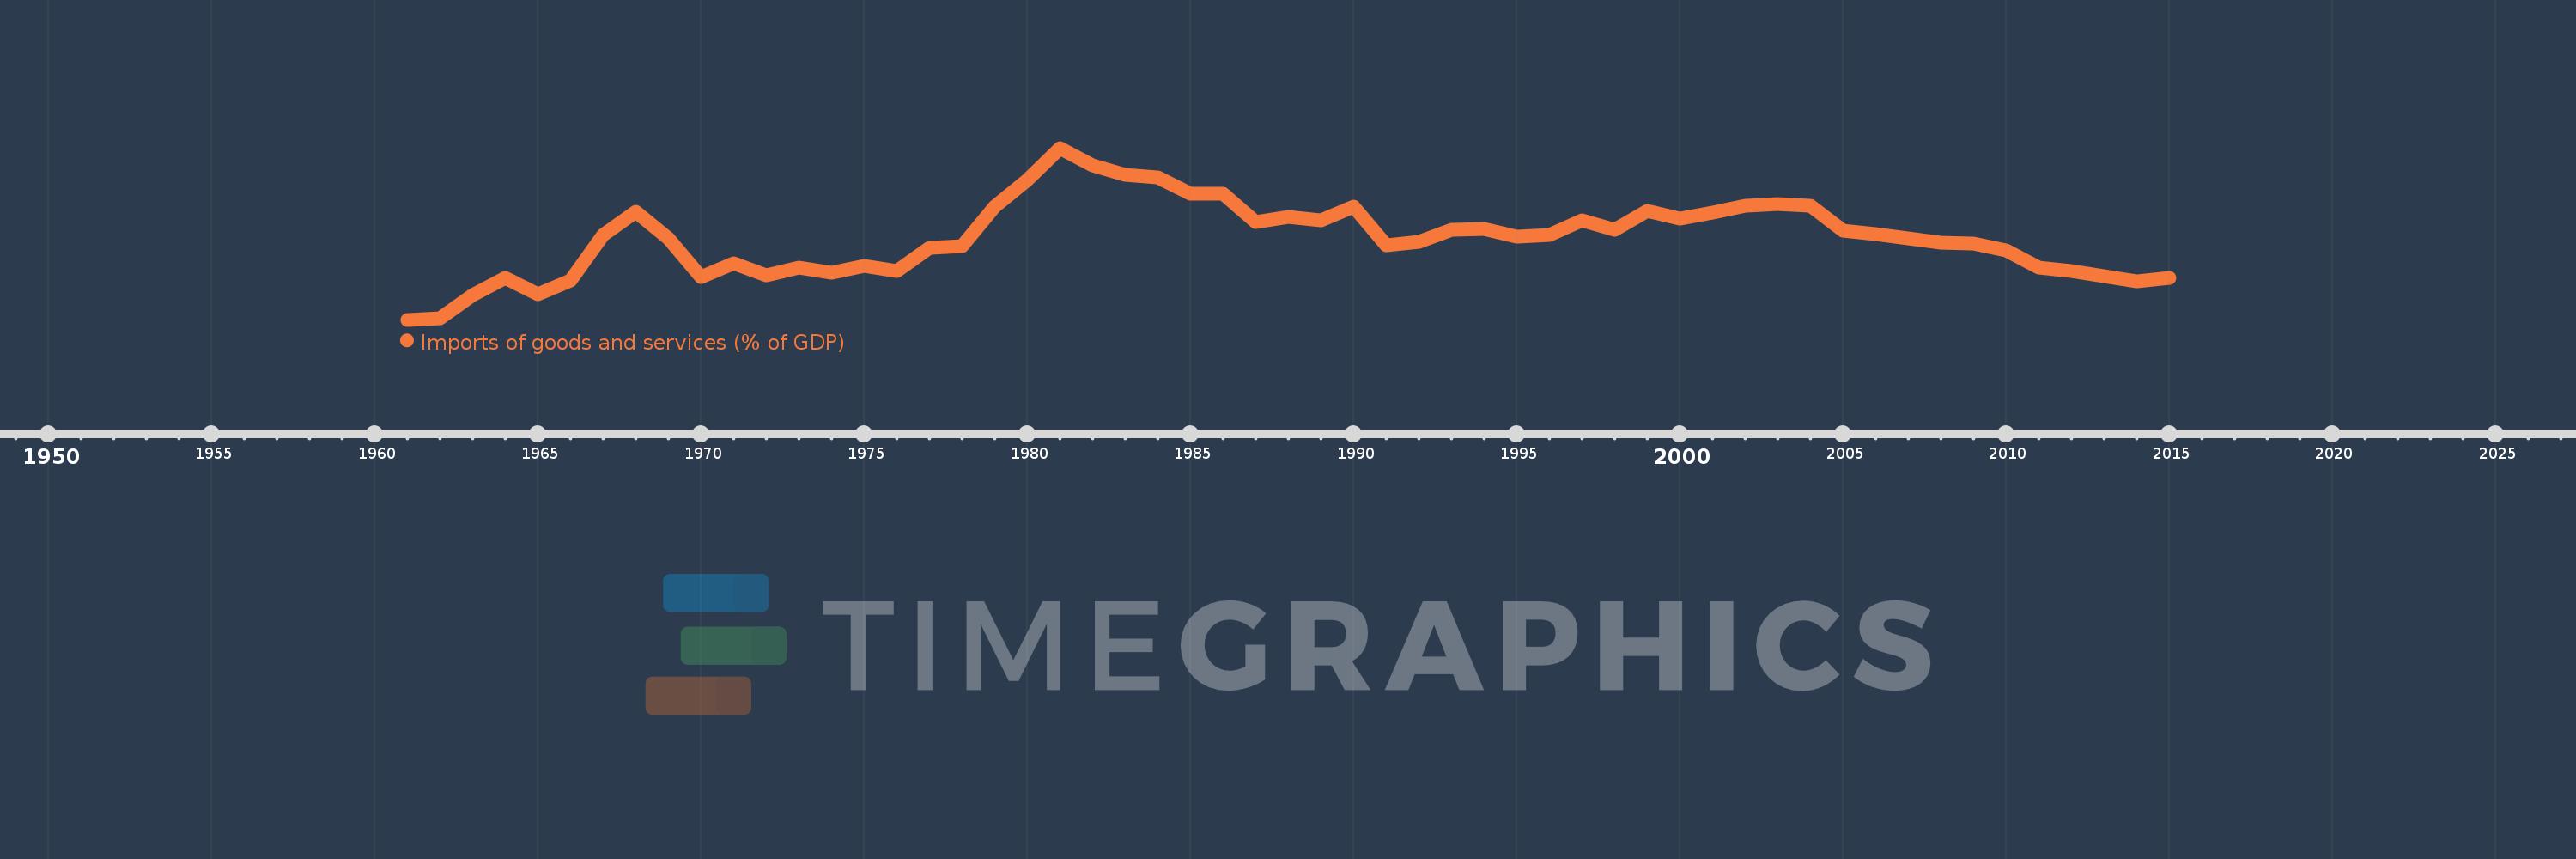
Imports of goods and services (% of GDP)
2015,2014,2013,2012,2011,2010,2009,2008,2007,2006,2005,2004,2003,2002,2001,2000,1999,1998,1997,1996,1995,1994,1993,1992,1991,1990,1989,1988,1987,1986,1985,1984,1983,1982,1981,1980,1979,1978,1977,1976,1975,1974,1973,1972,1971,1970,1969,1968,1967,1966,1965,1964,1963,1962,1961
This statistics in other country:
AfghanistanAlbaniaAlgeriaAngolaAntigua and BarbudaArab WorldArgentinaArmeniaArubaAustraliaAustriaAzerbaijanBahamas, TheBahrainBangladeshBarbadosBelarusBelgiumBelizeBeninBermudaBhutanBoliviaBosnia and HerzegovinaBotswanaBrazilBrunei DarussalamBulgariaBurkina FasoBurundiCabo VerdeCambodiaCameroonCanadaCaribbean small statesCentral African RepublicCentral Europe and the BalticsChadChileChinaColombiaComorosCongo, Dem. Rep.Congo, Rep.Costa RicaCote d'IvoireCroatiaCubaCyprusCzech RepublicDenmarkDjiboutiDominicaDominican RepublicEarly-demographic dividendEast Asia & PacificEast Asia & Pacific (excluding high income)East Asia & Pacific (IDA & IBRD countries)EcuadorEgypt, Arab Rep.El SalvadorEquatorial GuineaEritreaEstoniaEthiopiaEuro areaEurope & Central AsiaEurope & Central Asia (excluding high income)Europe & Central Asia (IDA & IBRD countries)European UnionFaroe IslandsFijiFinlandFragile and conflict affected situationsFranceFrench PolynesiaGabonGambia, TheGeorgiaGermanyGhanaGreeceGrenadaGuatemalaGuineaGuinea-BissauGuyanaHaitiHeavily indebted poor countries (HIPC)High incomeHondurasHong Kong SAR, ChinaHungaryIBRD onlyIcelandIDA & IBRD totalIDA blendIDA onlyIDA totalIndiaIndonesiaIran, Islamic Rep.IraqIrelandIsraelItalyJamaicaJapanJordanKazakhstanKenyaKiribatiKorea, Rep.KosovoKuwaitKyrgyz RepublicLao PDRLate-demographic dividendLatin America & Caribbean Latin America & Caribbean (excluding high income)Latin America & the Caribbean (IDA & IBRD countries)LatviaLeast developed countries: UN classificationLebanonLesothoLiberiaLibyaLithuaniaLow & middle incomeLow incomeLower middle incomeLuxembourgMacao SAR, ChinaMacedonia, FYRMadagascarMalawiMalaysiaMaldivesMaliMaltaMauritaniaMauritiusMexicoMicronesia, Fed. Sts.Middle East & North AfricaMiddle East & North Africa (excluding high income)Middle East & North Africa (IDA & IBRD countries)Middle incomeMoldovaMongoliaMontenegroMoroccoMozambiqueMyanmarNamibiaNepalNetherlandsNew CaledoniaNew ZealandNicaraguaNigerNigeriaNorth AmericaNorwayOECD membersOmanOther small statesPacific island small statesPakistanPalauPanamaPapua New GuineaParaguayPeruPhilippinesPolandPortugalPost-demographic dividendPre-demographic dividendPuerto RicoQatarRomaniaRussian FederationRwandaSamoaSaudi ArabiaSenegalSerbiaSeychellesSierra LeoneSingaporeSlovak RepublicSloveniaSmall statesSolomon IslandsSomaliaSouth AfricaSouth AsiaSouth Asia (IDA & IBRD)South SudanSpainSri LankaSt. Kitts and NevisSt. LuciaSt. Vincent and the GrenadinesSub-Saharan Africa Sub-Saharan Africa (excluding high income)Sub-Saharan Africa (IDA & IBRD countries)SudanSurinameSwazilandSwedenSwitzerlandSyrian Arab RepublicTajikistanTanzaniaThailandTimor-LesteTogoTongaTrinidad and TobagoTunisiaTurkeyTurkmenistanUgandaUkraineUnited Arab EmiratesUnited KingdomUnited StatesUpper middle incomeUruguayUzbekistanVanuatuVenezuela, RBVietnamWest Bank and GazaWorldYemen, Rep.ZambiaZimbabwe Timeline:
This timeline shows a graph from 1961 to 2015 of Swaziland. No data until 1960. Number of actual observations by date: 55.
Source name:
World Development Indicators
Source organization:
World Bank national accounts data, and OECD National Accounts data files.
Categories, topics:
Economy & Growth, Trade
Last updated:
apr 23, 2017
Indicators value changes by year
Minimum:
34.325
jan 1, 1961
Maximum:
114.046
jan 1, 1981
At the date of observation
Value
Absolute change
Change from previous value
jan 1, 1961
34.325
+34.325
0.0%
jan 1, 1962
34.816
+0.491
1.43%
jan 1, 1963
45.724
+10.908
31.33%
jan 1, 1964
53.538
+7.815
17.09%
jan 1, 1965
46.106
-7.432
-13.88%
jan 1, 1966
52.59
+6.484
14.06%
jan 1, 1967
73.77
+21.181
40.28%
jan 1, 1968
84.27
+10.499
14.23%
jan 1, 1969
72.105
-12.164
-14.44%
jan 1, 1970
54.183
-17.922
-24.86%
jan 1, 1971
60.424
+6.241
11.52%
jan 1, 1972
54.918
-5.506
-9.11%
jan 1, 1973
58.599
+3.681
6.7%
jan 1, 1974
56.169
-2.43
-4.15%
jan 1, 1975
59.243
+3.074
5.47%
jan 1, 1976
56.895
-2.348
-3.96%
jan 1, 1977
67.595
+10.7
18.81%
jan 1, 1978
68.646
+1.051
1.55%
jan 1, 1979
86.664
+18.018
26.25%
jan 1, 1980
99.222
+12.557
14.49%
jan 1, 1981
114.046
+14.824
14.94%
jan 1, 1982
105.83
-8.217
-7.2%
jan 1, 1983
101.645
-4.185
-3.95%
jan 1, 1984
100.436
-1.208
-1.19%
jan 1, 1985
92.748
-7.688
-7.65%
jan 1, 1986
92.844
+0.095
0.1%
jan 1, 1987
79.772
-13.072
-14.08%
jan 1, 1988
82.107
+2.335
2.93%
jan 1, 1989
80.271
-1.836
-2.24%
jan 1, 1990
86.891
+6.621
8.25%
jan 1, 1991
68.881
-18.011
-20.73%
jan 1, 1992
70.637
+1.756
2.55%
jan 1, 1993
76.093
+5.456
7.72%
jan 1, 1994
76.377
+0.284
0.37%
jan 1, 1995
72.865
-3.512
-4.6%
jan 1, 1996
73.747
+0.882
1.21%
jan 1, 1997
80.632
+6.885
9.34%
jan 1, 1998
76.152
-4.481
-5.56%
jan 1, 1999
84.777
+8.625
11.33%
jan 1, 2000
81.267
-3.51
-4.14%
jan 1, 2001
84.08
+2.813
3.46%
jan 1, 2002
87.16
+3.08
3.66%
jan 1, 2003
87.931
+0.771
0.89%
jan 1, 2004
87.034
-0.897
-1.02%
jan 1, 2005
75.778
-11.257
-12.93%
jan 1, 2006
73.948
-1.83
-2.41%
jan 1, 2007
71.957
-1.991
-2.69%
jan 1, 2008
69.953
-2.003
-2.78%
jan 1, 2009
69.484
-0.469
-0.67%
jan 1, 2010
66.677
-2.808
-4.04%
jan 1, 2011
58.425
-8.252
-12.38%
jan 1, 2012
56.813
-1.612
-2.76%
jan 1, 2013
54.424
-2.389
-4.2%
jan 1, 2014
52.25
-2.174
-4.0%
jan 1, 2015
53.727
+1.477
2.83%
Ranking of countries by current statistics by years


Comments: