29
/
en
AIzaSyAYiBZKx7MnpbEhh9jyipgxe19OcubqV5w
April 1, 2024
203047
Mozambique
MOZ
true
2
1
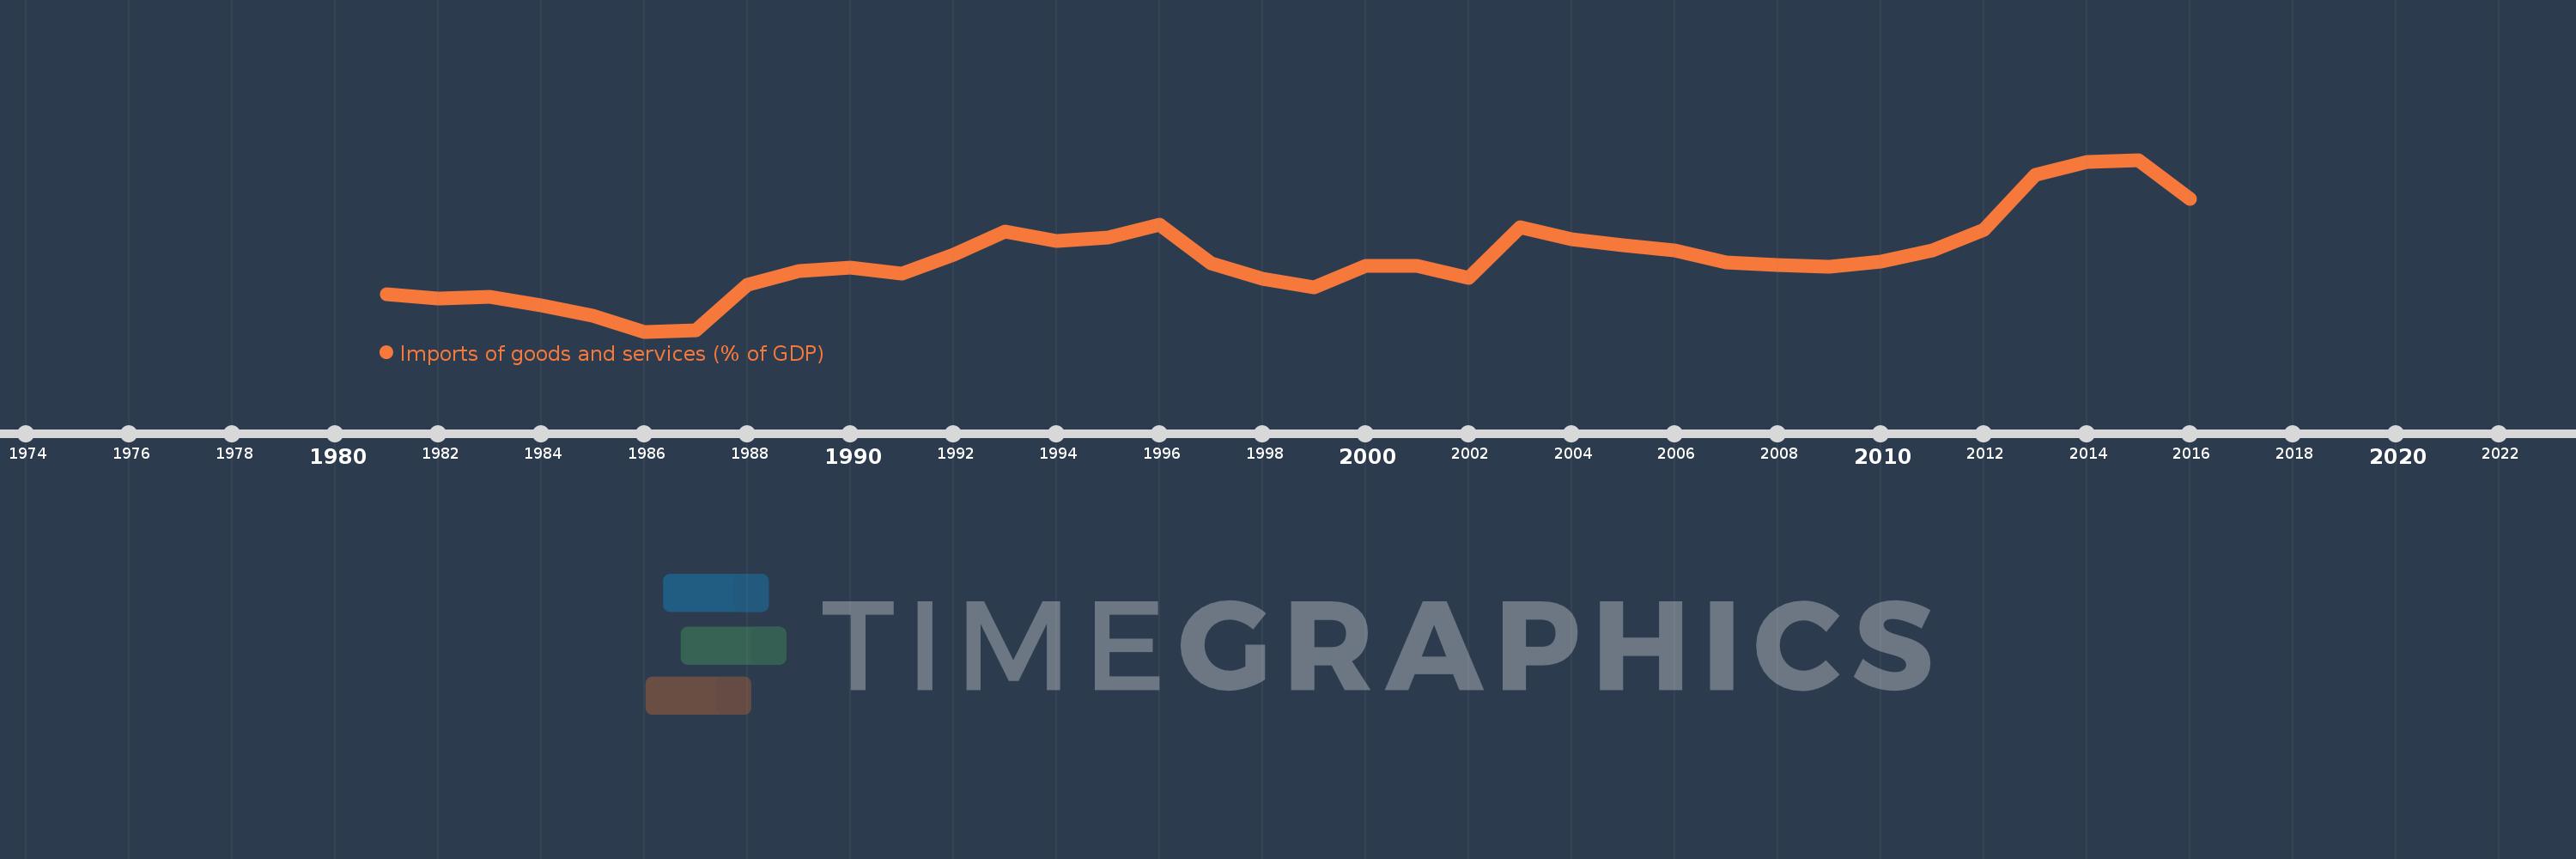
Imports of goods and services (% of GDP)
2016,2015,2014,2013,2012,2011,2010,2009,2008,2007,2006,2005,2004,2003,2002,2001,2000,1999,1998,1997,1996,1995,1994,1993,1992,1991,1990,1989,1988,1987,1986,1985,1984,1983,1982,1981
This statistics in other country:
AfghanistanAlbaniaAlgeriaAngolaAntigua and BarbudaArab WorldArgentinaArmeniaArubaAustraliaAustriaAzerbaijanBahamas, TheBahrainBangladeshBarbadosBelarusBelgiumBelizeBeninBermudaBhutanBoliviaBosnia and HerzegovinaBotswanaBrazilBrunei DarussalamBulgariaBurkina FasoBurundiCabo VerdeCambodiaCameroonCanadaCaribbean small statesCentral African RepublicCentral Europe and the BalticsChadChileChinaColombiaComorosCongo, Dem. Rep.Congo, Rep.Costa RicaCote d'IvoireCroatiaCubaCyprusCzech RepublicDenmarkDjiboutiDominicaDominican RepublicEarly-demographic dividendEast Asia & PacificEast Asia & Pacific (excluding high income)East Asia & Pacific (IDA & IBRD countries)EcuadorEgypt, Arab Rep.El SalvadorEquatorial GuineaEritreaEstoniaEthiopiaEuro areaEurope & Central AsiaEurope & Central Asia (excluding high income)Europe & Central Asia (IDA & IBRD countries)European UnionFaroe IslandsFijiFinlandFragile and conflict affected situationsFranceFrench PolynesiaGabonGambia, TheGeorgiaGermanyGhanaGreeceGrenadaGuatemalaGuineaGuinea-BissauGuyanaHaitiHeavily indebted poor countries (HIPC)High incomeHondurasHong Kong SAR, ChinaHungaryIBRD onlyIcelandIDA & IBRD totalIDA blendIDA onlyIDA totalIndiaIndonesiaIran, Islamic Rep.IraqIrelandIsraelItalyJamaicaJapanJordanKazakhstanKenyaKiribatiKorea, Rep.KosovoKuwaitKyrgyz RepublicLao PDRLate-demographic dividendLatin America & Caribbean Latin America & Caribbean (excluding high income)Latin America & the Caribbean (IDA & IBRD countries)LatviaLeast developed countries: UN classificationLebanonLesothoLiberiaLibyaLithuaniaLow & middle incomeLow incomeLower middle incomeLuxembourgMacao SAR, ChinaMacedonia, FYRMadagascarMalawiMalaysiaMaldivesMaliMaltaMauritaniaMauritiusMexicoMicronesia, Fed. Sts.Middle East & North AfricaMiddle East & North Africa (excluding high income)Middle East & North Africa (IDA & IBRD countries)Middle incomeMoldovaMongoliaMontenegroMoroccoMozambiqueMyanmarNamibiaNepalNetherlandsNew CaledoniaNew ZealandNicaraguaNigerNigeriaNorth AmericaNorwayOECD membersOmanOther small statesPacific island small statesPakistanPalauPanamaPapua New GuineaParaguayPeruPhilippinesPolandPortugalPost-demographic dividendPre-demographic dividendPuerto RicoQatarRomaniaRussian FederationRwandaSamoaSaudi ArabiaSenegalSerbiaSeychellesSierra LeoneSingaporeSlovak RepublicSloveniaSmall statesSolomon IslandsSomaliaSouth AfricaSouth AsiaSouth Asia (IDA & IBRD)South SudanSpainSri LankaSt. Kitts and NevisSt. LuciaSt. Vincent and the GrenadinesSub-Saharan Africa Sub-Saharan Africa (excluding high income)Sub-Saharan Africa (IDA & IBRD countries)SudanSurinameSwazilandSwedenSwitzerlandSyrian Arab RepublicTajikistanTanzaniaThailandTimor-LesteTogoTongaTrinidad and TobagoTunisiaTurkeyTurkmenistanUgandaUkraineUnited Arab EmiratesUnited KingdomUnited StatesUpper middle incomeUruguayUzbekistanVanuatuVenezuela, RBVietnamWest Bank and GazaWorldYemen, Rep.ZambiaZimbabwe Timeline:
This timeline shows a graph from 1981 to 2016 of Mozambique. No data until 1980. Number of actual observations by date: 36.
Source name:
World Development Indicators
Source organization:
World Bank national accounts data, and OECD National Accounts data files.
Categories, topics:
Economy & Growth, Trade
Last updated:
apr 23, 2017
Indicators value changes by year
Minimum:
11.466
jan 1, 1986
Maximum:
84.763
jan 1, 2015
At the date of observation
Value
Absolute change
Change from previous value
jan 1, 1981
27.359
+27.359
0.0%
jan 1, 1982
25.754
-1.605
-5.87%
jan 1, 1983
26.214
+0.46
1.79%
jan 1, 1984
22.763
-3.451
-13.16%
jan 1, 1985
18.36
-4.404
-19.34%
jan 1, 1986
11.466
-6.894
-37.55%
jan 1, 1987
12.026
+0.56
4.89%
jan 1, 1988
31.385
+19.359
160.97%
jan 1, 1989
37.298
+5.913
18.84%
jan 1, 1990
38.649
+1.351
3.62%
jan 1, 1991
36.068
-2.581
-6.68%
jan 1, 1992
44.154
+8.086
22.42%
jan 1, 1993
54.188
+10.034
22.73%
jan 1, 1994
50.238
-3.951
-7.29%
jan 1, 1995
51.758
+1.52
3.03%
jan 1, 1996
56.92
+5.162
9.97%
jan 1, 1997
40.545
-16.375
-28.77%
jan 1, 1998
34.077
-6.468
-15.95%
jan 1, 1999
30.201
-3.876
-11.38%
jan 1, 2000
39.52
+9.32
30.86%
jan 1, 2001
39.564
+0.044
0.11%
jan 1, 2002
34.301
-5.264
-13.3%
jan 1, 2003
56.006
+21.705
63.28%
jan 1, 2004
50.945
-5.06
-9.04%
jan 1, 2005
48.28
-2.665
-5.23%
jan 1, 2006
46.177
-2.103
-4.36%
jan 1, 2007
40.985
-5.192
-11.24%
jan 1, 2008
39.912
-1.073
-2.62%
jan 1, 2009
39.173
-0.739
-1.85%
jan 1, 2010
41.277
+2.104
5.37%
jan 1, 2011
46.221
+4.944
11.98%
jan 1, 2012
54.908
+8.686
18.79%
jan 1, 2013
78.454
+23.546
42.88%
jan 1, 2014
84.007
+5.553
7.08%
jan 1, 2015
84.763
+0.757
0.9%
jan 1, 2016
68.009
-16.754
-19.77%
Ranking of countries by current statistics by years


Comments: