29
/
en
AIzaSyAYiBZKx7MnpbEhh9jyipgxe19OcubqV5w
April 1, 2024
240561
Singapore
SGP
true
2
1
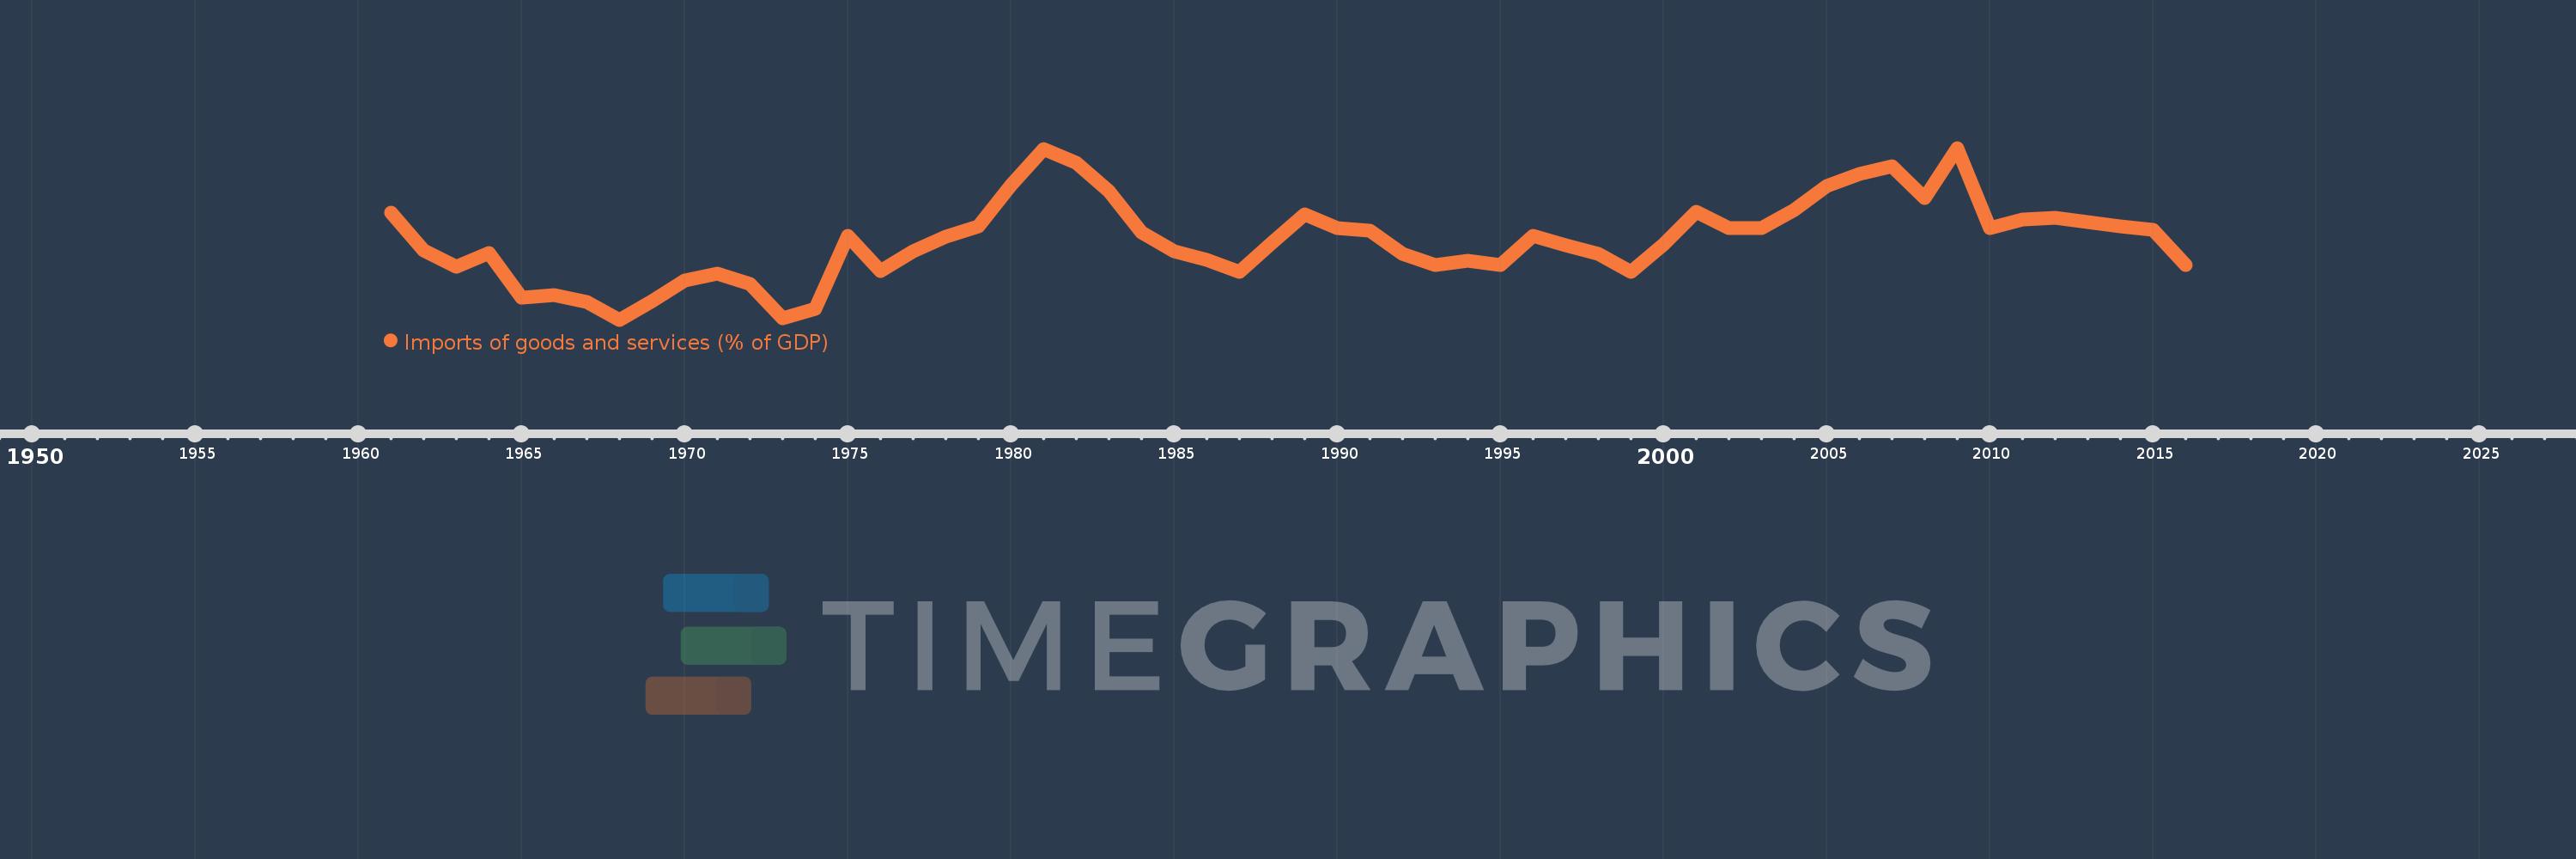
Imports of goods and services (% of GDP)
2016,2015,2014,2013,2012,2011,2010,2009,2008,2007,2006,2005,2004,2003,2002,2001,2000,1999,1998,1997,1996,1995,1994,1993,1992,1991,1990,1989,1988,1987,1986,1985,1984,1983,1982,1981,1980,1979,1978,1977,1976,1975,1974,1973,1972,1971,1970,1969,1968,1967,1966,1965,1964,1963,1962,1961
This statistics in other country:
AfghanistanAlbaniaAlgeriaAngolaAntigua and BarbudaArab WorldArgentinaArmeniaArubaAustraliaAustriaAzerbaijanBahamas, TheBahrainBangladeshBarbadosBelarusBelgiumBelizeBeninBermudaBhutanBoliviaBosnia and HerzegovinaBotswanaBrazilBrunei DarussalamBulgariaBurkina FasoBurundiCabo VerdeCambodiaCameroonCanadaCaribbean small statesCentral African RepublicCentral Europe and the BalticsChadChileChinaColombiaComorosCongo, Dem. Rep.Congo, Rep.Costa RicaCote d'IvoireCroatiaCubaCyprusCzech RepublicDenmarkDjiboutiDominicaDominican RepublicEarly-demographic dividendEast Asia & PacificEast Asia & Pacific (excluding high income)East Asia & Pacific (IDA & IBRD countries)EcuadorEgypt, Arab Rep.El SalvadorEquatorial GuineaEritreaEstoniaEthiopiaEuro areaEurope & Central AsiaEurope & Central Asia (excluding high income)Europe & Central Asia (IDA & IBRD countries)European UnionFaroe IslandsFijiFinlandFragile and conflict affected situationsFranceFrench PolynesiaGabonGambia, TheGeorgiaGermanyGhanaGreeceGrenadaGuatemalaGuineaGuinea-BissauGuyanaHaitiHeavily indebted poor countries (HIPC)High incomeHondurasHong Kong SAR, ChinaHungaryIBRD onlyIcelandIDA & IBRD totalIDA blendIDA onlyIDA totalIndiaIndonesiaIran, Islamic Rep.IraqIrelandIsraelItalyJamaicaJapanJordanKazakhstanKenyaKiribatiKorea, Rep.KosovoKuwaitKyrgyz RepublicLao PDRLate-demographic dividendLatin America & Caribbean Latin America & Caribbean (excluding high income)Latin America & the Caribbean (IDA & IBRD countries)LatviaLeast developed countries: UN classificationLebanonLesothoLiberiaLibyaLithuaniaLow & middle incomeLow incomeLower middle incomeLuxembourgMacao SAR, ChinaMacedonia, FYRMadagascarMalawiMalaysiaMaldivesMaliMaltaMauritaniaMauritiusMexicoMicronesia, Fed. Sts.Middle East & North AfricaMiddle East & North Africa (excluding high income)Middle East & North Africa (IDA & IBRD countries)Middle incomeMoldovaMongoliaMontenegroMoroccoMozambiqueMyanmarNamibiaNepalNetherlandsNew CaledoniaNew ZealandNicaraguaNigerNigeriaNorth AmericaNorwayOECD membersOmanOther small statesPacific island small statesPakistanPalauPanamaPapua New GuineaParaguayPeruPhilippinesPolandPortugalPost-demographic dividendPre-demographic dividendPuerto RicoQatarRomaniaRussian FederationRwandaSamoaSaudi ArabiaSenegalSerbiaSeychellesSierra LeoneSingaporeSlovak RepublicSloveniaSmall statesSolomon IslandsSomaliaSouth AfricaSouth AsiaSouth Asia (IDA & IBRD)South SudanSpainSri LankaSt. Kitts and NevisSt. LuciaSt. Vincent and the GrenadinesSub-Saharan Africa Sub-Saharan Africa (excluding high income)Sub-Saharan Africa (IDA & IBRD countries)SudanSurinameSwazilandSwedenSwitzerlandSyrian Arab RepublicTajikistanTanzaniaThailandTimor-LesteTogoTongaTrinidad and TobagoTunisiaTurkeyTurkmenistanUgandaUkraineUnited Arab EmiratesUnited KingdomUnited StatesUpper middle incomeUruguayUzbekistanVanuatuVenezuela, RBVietnamWest Bank and GazaWorldYemen, Rep.ZambiaZimbabwe Timeline:
This timeline shows a graph from 1961 to 2016 of Singapore. No data until 1960. Number of actual observations by date: 56.
Source name:
World Development Indicators
Source organization:
World Bank national accounts data, and OECD National Accounts data files.
Categories, topics:
Economy & Growth, Trade
Last updated:
apr 23, 2017
Indicators value changes by year
Minimum:
121.703
jan 1, 1968
Maximum:
209.388
jan 1, 2009
At the date of observation
Value
Absolute change
Change from previous value
jan 1, 1961
176.555
+176.555
0.0%
jan 1, 1962
157.046
-19.509
-11.05%
jan 1, 1963
148.588
-8.458
-5.39%
jan 1, 1964
155.795
+7.207
4.85%
jan 1, 1965
133.009
-22.785
-14.63%
jan 1, 1966
134.367
+1.358
1.02%
jan 1, 1967
130.562
-3.805
-2.83%
jan 1, 1968
121.703
-8.859
-6.79%
jan 1, 1969
131.204
+9.501
7.81%
jan 1, 1970
141.645
+10.441
7.96%
jan 1, 1971
145.114
+3.47
2.45%
jan 1, 1972
139.91
-5.204
-3.59%
jan 1, 1973
122.384
-17.526
-12.53%
jan 1, 1974
127.477
+5.093
4.16%
jan 1, 1975
164.643
+37.167
29.16%
jan 1, 1976
146.456
-18.187
-11.05%
jan 1, 1977
156.435
+9.979
6.81%
jan 1, 1978
164.251
+7.816
5.0%
jan 1, 1979
169.194
+4.943
3.01%
jan 1, 1980
190.38
+21.186
12.52%
jan 1, 1981
208.981
+18.601
9.77%
jan 1, 1982
201.644
-7.337
-3.51%
jan 1, 1983
187.247
-14.397
-7.14%
jan 1, 1984
166.364
-20.883
-11.15%
jan 1, 1985
156.766
-9.598
-5.77%
jan 1, 1986
152.067
-4.699
-3.0%
jan 1, 1987
146.233
-5.834
-3.84%
jan 1, 1988
161.201
+14.969
10.24%
jan 1, 1989
175.39
+14.188
8.8%
jan 1, 1990
168.508
-6.882
-3.92%
jan 1, 1991
167.104
-1.404
-0.83%
jan 1, 1992
155.314
-11.791
-7.06%
jan 1, 1993
149.511
-5.802
-3.74%
jan 1, 1994
151.663
+2.151
1.44%
jan 1, 1995
149.846
-1.816
-1.2%
jan 1, 1996
164.523
+14.676
9.79%
jan 1, 1997
159.861
-4.662
-2.83%
jan 1, 1998
155.487
-4.374
-2.74%
jan 1, 1999
146.29
-9.197
-5.91%
jan 1, 2000
160.358
+14.068
9.62%
jan 1, 2001
176.89
+16.532
10.31%
jan 1, 2002
168.27
-8.62
-4.87%
jan 1, 2003
168.314
+0.044
0.03%
jan 1, 2004
177.63
+9.316
5.53%
jan 1, 2005
189.956
+12.326
6.94%
jan 1, 2006
196.251
+6.295
3.31%
jan 1, 2007
200.254
+4.003
2.04%
jan 1, 2008
183.916
-16.339
-8.16%
jan 1, 2009
209.388
+25.472
13.85%
jan 1, 2010
168.351
-41.037
-19.6%
jan 1, 2011
172.84
+4.49
2.67%
jan 1, 2012
173.77
+0.93
0.54%
jan 1, 2013
171.75
-2.021
-1.16%
jan 1, 2014
169.238
-2.511
-1.46%
jan 1, 2015
167.663
-1.575
-0.93%
jan 1, 2016
149.622
-18.041
-10.76%
Ranking of countries by current statistics by years


Comments: