29
/
en
AIzaSyAYiBZKx7MnpbEhh9jyipgxe19OcubqV5w
April 1, 2024
174232
Lao PDR
LAO
true
2
1
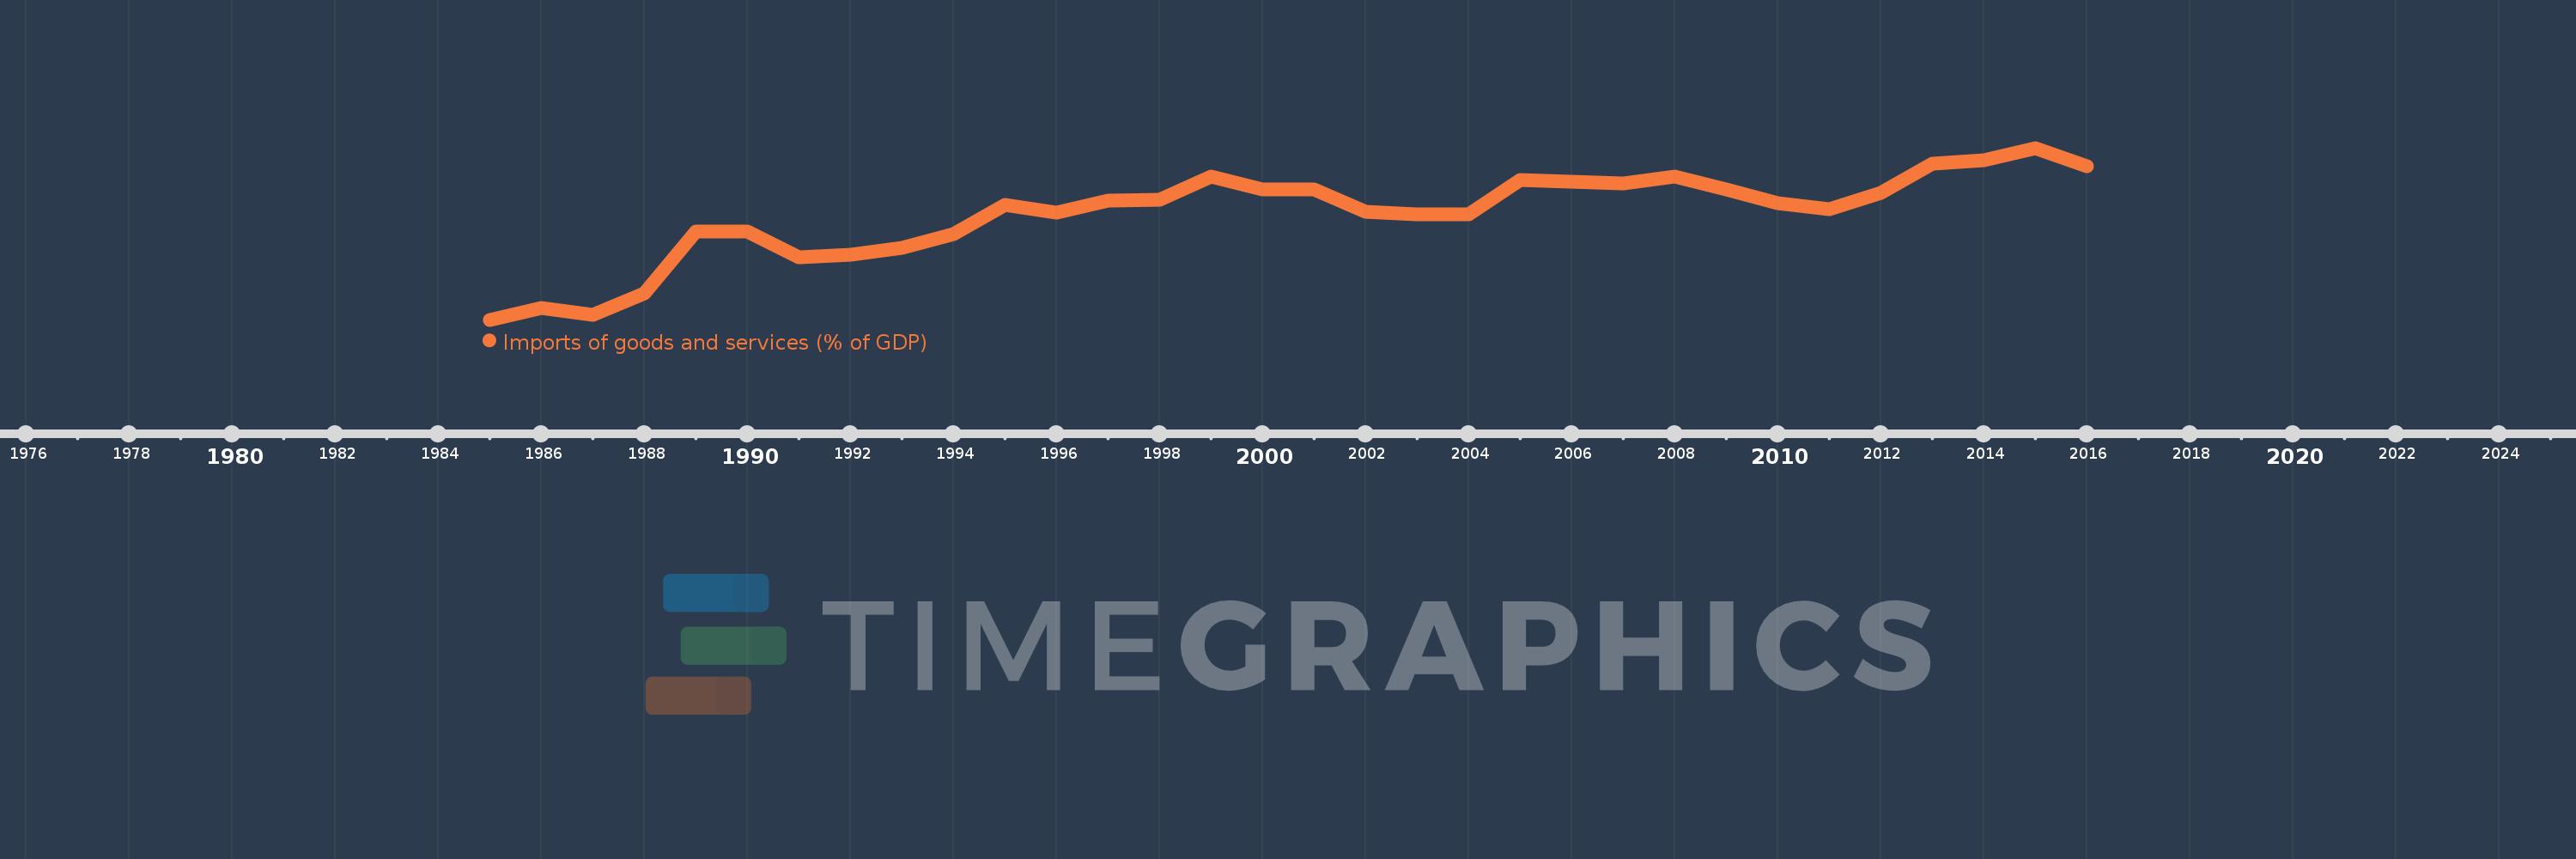
Imports of goods and services (% of GDP)
2016,2015,2014,2013,2012,2011,2010,2009,2008,2007,2006,2005,2004,2003,2002,2001,2000,1999,1998,1997,1996,1995,1994,1993,1992,1991,1990,1989,1988,1987,1986,1985
This statistics in other country:
AfghanistanAlbaniaAlgeriaAngolaAntigua and BarbudaArab WorldArgentinaArmeniaArubaAustraliaAustriaAzerbaijanBahamas, TheBahrainBangladeshBarbadosBelarusBelgiumBelizeBeninBermudaBhutanBoliviaBosnia and HerzegovinaBotswanaBrazilBrunei DarussalamBulgariaBurkina FasoBurundiCabo VerdeCambodiaCameroonCanadaCaribbean small statesCentral African RepublicCentral Europe and the BalticsChadChileChinaColombiaComorosCongo, Dem. Rep.Congo, Rep.Costa RicaCote d'IvoireCroatiaCubaCyprusCzech RepublicDenmarkDjiboutiDominicaDominican RepublicEarly-demographic dividendEast Asia & PacificEast Asia & Pacific (excluding high income)East Asia & Pacific (IDA & IBRD countries)EcuadorEgypt, Arab Rep.El SalvadorEquatorial GuineaEritreaEstoniaEthiopiaEuro areaEurope & Central AsiaEurope & Central Asia (excluding high income)Europe & Central Asia (IDA & IBRD countries)European UnionFaroe IslandsFijiFinlandFragile and conflict affected situationsFranceFrench PolynesiaGabonGambia, TheGeorgiaGermanyGhanaGreeceGrenadaGuatemalaGuineaGuinea-BissauGuyanaHaitiHeavily indebted poor countries (HIPC)High incomeHondurasHong Kong SAR, ChinaHungaryIBRD onlyIcelandIDA & IBRD totalIDA blendIDA onlyIDA totalIndiaIndonesiaIran, Islamic Rep.IraqIrelandIsraelItalyJamaicaJapanJordanKazakhstanKenyaKiribatiKorea, Rep.KosovoKuwaitKyrgyz RepublicLao PDRLate-demographic dividendLatin America & Caribbean Latin America & Caribbean (excluding high income)Latin America & the Caribbean (IDA & IBRD countries)LatviaLeast developed countries: UN classificationLebanonLesothoLiberiaLibyaLithuaniaLow & middle incomeLow incomeLower middle incomeLuxembourgMacao SAR, ChinaMacedonia, FYRMadagascarMalawiMalaysiaMaldivesMaliMaltaMauritaniaMauritiusMexicoMicronesia, Fed. Sts.Middle East & North AfricaMiddle East & North Africa (excluding high income)Middle East & North Africa (IDA & IBRD countries)Middle incomeMoldovaMongoliaMontenegroMoroccoMozambiqueMyanmarNamibiaNepalNetherlandsNew CaledoniaNew ZealandNicaraguaNigerNigeriaNorth AmericaNorwayOECD membersOmanOther small statesPacific island small statesPakistanPalauPanamaPapua New GuineaParaguayPeruPhilippinesPolandPortugalPost-demographic dividendPre-demographic dividendPuerto RicoQatarRomaniaRussian FederationRwandaSamoaSaudi ArabiaSenegalSerbiaSeychellesSierra LeoneSingaporeSlovak RepublicSloveniaSmall statesSolomon IslandsSomaliaSouth AfricaSouth AsiaSouth Asia (IDA & IBRD)South SudanSpainSri LankaSt. Kitts and NevisSt. LuciaSt. Vincent and the GrenadinesSub-Saharan Africa Sub-Saharan Africa (excluding high income)Sub-Saharan Africa (IDA & IBRD countries)SudanSurinameSwazilandSwedenSwitzerlandSyrian Arab RepublicTajikistanTanzaniaThailandTimor-LesteTogoTongaTrinidad and TobagoTunisiaTurkeyTurkmenistanUgandaUkraineUnited Arab EmiratesUnited KingdomUnited StatesUpper middle incomeUruguayUzbekistanVanuatuVenezuela, RBVietnamWest Bank and GazaWorldYemen, Rep.ZambiaZimbabwe Timeline:
This timeline shows a graph from 1985 to 2016 of Lao PDR. No data until 1984. Number of actual observations by date: 32.
Source name:
World Development Indicators
Source organization:
World Bank national accounts data, and OECD National Accounts data files.
Categories, topics:
Economy & Growth, Trade
Last updated:
apr 23, 2017
Indicators value changes by year
Maximum:
56.244
jan 1, 2015
At the date of observation
Value
Absolute change
Change from previous value
jan 1, 1985
6.341
+6.341
0.0%
jan 1, 1986
9.765
+3.424
53.99%
jan 1, 1987
7.701
-2.064
-21.13%
jan 1, 1988
14.023
+6.322
82.08%
jan 1, 1989
31.899
+17.876
127.48%
jan 1, 1990
31.996
+0.097
0.3%
jan 1, 1991
24.518
-7.478
-23.37%
jan 1, 1992
25.229
+0.71
2.9%
jan 1, 1993
27.105
+1.876
7.44%
jan 1, 1994
31.167
+4.062
14.99%
jan 1, 1995
39.822
+8.655
27.77%
jan 1, 1996
37.334
-2.488
-6.25%
jan 1, 1997
41.058
+3.724
9.98%
jan 1, 1998
41.265
+0.206
0.5%
jan 1, 1999
47.814
+6.549
15.87%
jan 1, 2000
44.183
-3.631
-7.59%
jan 1, 2001
44.214
+0.032
0.07%
jan 1, 2002
37.81
-6.405
-14.49%
jan 1, 2003
36.894
-0.916
-2.42%
jan 1, 2004
37.047
+0.153
0.41%
jan 1, 2005
46.954
+9.908
26.74%
jan 1, 2006
46.499
-0.455
-0.97%
jan 1, 2007
45.923
-0.577
-1.24%
jan 1, 2008
47.958
+2.035
4.43%
jan 1, 2009
44.212
-3.746
-7.81%
jan 1, 2010
40.091
-4.121
-9.32%
jan 1, 2011
38.407
-1.684
-4.2%
jan 1, 2012
43.162
+4.755
12.38%
jan 1, 2013
51.626
+8.464
19.61%
jan 1, 2014
52.636
+1.01
1.96%
jan 1, 2015
56.244
+3.608
6.86%
jan 1, 2016
50.96
-5.284
-9.4%
Ranking of countries by current statistics by years


Comments: