29
/
en
AIzaSyAYiBZKx7MnpbEhh9jyipgxe19OcubqV5w
April 1, 2024
144497
Guatemala
GTM
true
2
1
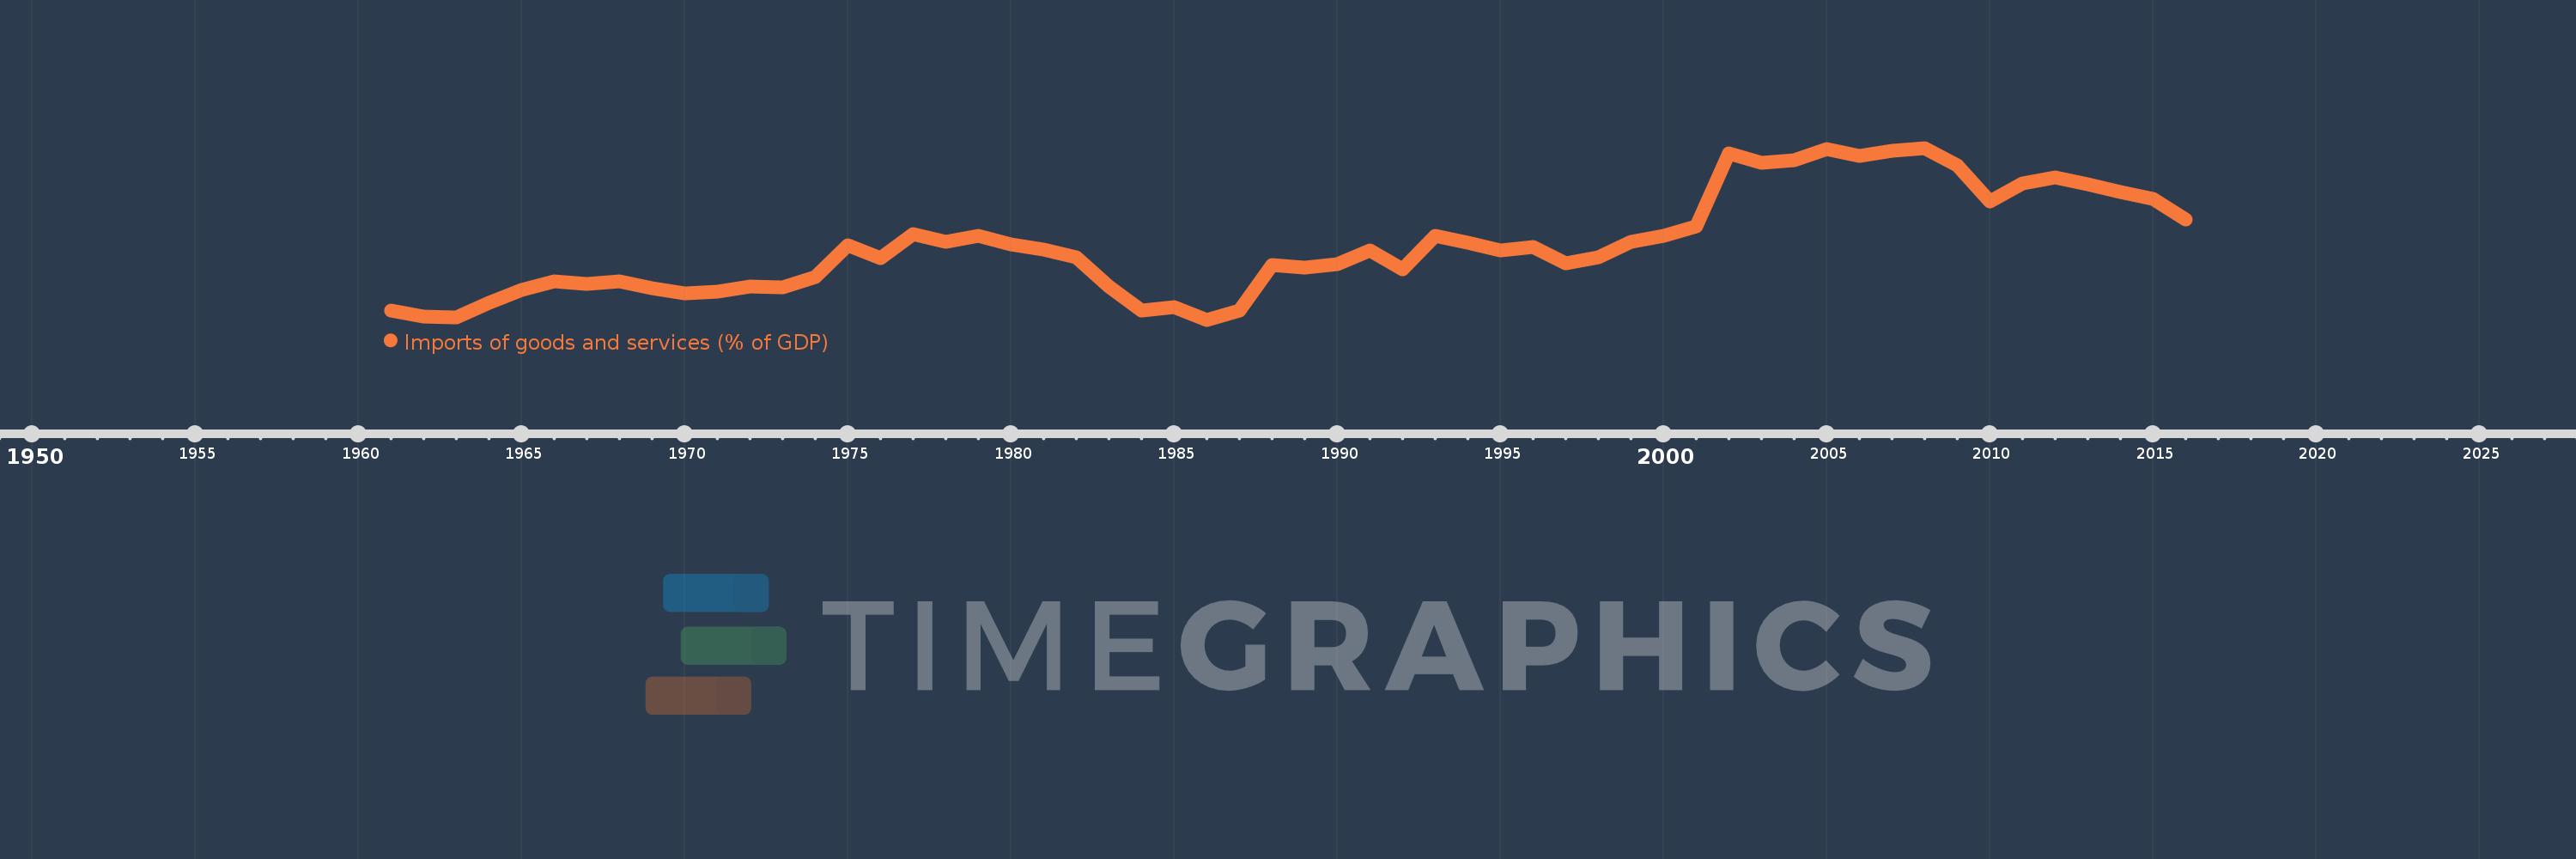
Imports of goods and services (% of GDP)
2016,2015,2014,2013,2012,2011,2010,2009,2008,2007,2006,2005,2004,2003,2002,2001,2000,1999,1998,1997,1996,1995,1994,1993,1992,1991,1990,1989,1988,1987,1986,1985,1984,1983,1982,1981,1980,1979,1978,1977,1976,1975,1974,1973,1972,1971,1970,1969,1968,1967,1966,1965,1964,1963,1962,1961
This statistics in other country:
AfghanistanAlbaniaAlgeriaAngolaAntigua and BarbudaArab WorldArgentinaArmeniaArubaAustraliaAustriaAzerbaijanBahamas, TheBahrainBangladeshBarbadosBelarusBelgiumBelizeBeninBermudaBhutanBoliviaBosnia and HerzegovinaBotswanaBrazilBrunei DarussalamBulgariaBurkina FasoBurundiCabo VerdeCambodiaCameroonCanadaCaribbean small statesCentral African RepublicCentral Europe and the BalticsChadChileChinaColombiaComorosCongo, Dem. Rep.Congo, Rep.Costa RicaCote d'IvoireCroatiaCubaCyprusCzech RepublicDenmarkDjiboutiDominicaDominican RepublicEarly-demographic dividendEast Asia & PacificEast Asia & Pacific (excluding high income)East Asia & Pacific (IDA & IBRD countries)EcuadorEgypt, Arab Rep.El SalvadorEquatorial GuineaEritreaEstoniaEthiopiaEuro areaEurope & Central AsiaEurope & Central Asia (excluding high income)Europe & Central Asia (IDA & IBRD countries)European UnionFaroe IslandsFijiFinlandFragile and conflict affected situationsFranceFrench PolynesiaGabonGambia, TheGeorgiaGermanyGhanaGreeceGrenadaGuatemalaGuineaGuinea-BissauGuyanaHaitiHeavily indebted poor countries (HIPC)High incomeHondurasHong Kong SAR, ChinaHungaryIBRD onlyIcelandIDA & IBRD totalIDA blendIDA onlyIDA totalIndiaIndonesiaIran, Islamic Rep.IraqIrelandIsraelItalyJamaicaJapanJordanKazakhstanKenyaKiribatiKorea, Rep.KosovoKuwaitKyrgyz RepublicLao PDRLate-demographic dividendLatin America & Caribbean Latin America & Caribbean (excluding high income)Latin America & the Caribbean (IDA & IBRD countries)LatviaLeast developed countries: UN classificationLebanonLesothoLiberiaLibyaLithuaniaLow & middle incomeLow incomeLower middle incomeLuxembourgMacao SAR, ChinaMacedonia, FYRMadagascarMalawiMalaysiaMaldivesMaliMaltaMauritaniaMauritiusMexicoMicronesia, Fed. Sts.Middle East & North AfricaMiddle East & North Africa (excluding high income)Middle East & North Africa (IDA & IBRD countries)Middle incomeMoldovaMongoliaMontenegroMoroccoMozambiqueMyanmarNamibiaNepalNetherlandsNew CaledoniaNew ZealandNicaraguaNigerNigeriaNorth AmericaNorwayOECD membersOmanOther small statesPacific island small statesPakistanPalauPanamaPapua New GuineaParaguayPeruPhilippinesPolandPortugalPost-demographic dividendPre-demographic dividendPuerto RicoQatarRomaniaRussian FederationRwandaSamoaSaudi ArabiaSenegalSerbiaSeychellesSierra LeoneSingaporeSlovak RepublicSloveniaSmall statesSolomon IslandsSomaliaSouth AfricaSouth AsiaSouth Asia (IDA & IBRD)South SudanSpainSri LankaSt. Kitts and NevisSt. LuciaSt. Vincent and the GrenadinesSub-Saharan Africa Sub-Saharan Africa (excluding high income)Sub-Saharan Africa (IDA & IBRD countries)SudanSurinameSwazilandSwedenSwitzerlandSyrian Arab RepublicTajikistanTanzaniaThailandTimor-LesteTogoTongaTrinidad and TobagoTunisiaTurkeyTurkmenistanUgandaUkraineUnited Arab EmiratesUnited KingdomUnited StatesUpper middle incomeUruguayUzbekistanVanuatuVenezuela, RBVietnamWest Bank and GazaWorldYemen, Rep.ZambiaZimbabwe Timeline:
This timeline shows a graph from 1961 to 2016 of Guatemala. No data until 1960. Number of actual observations by date: 56.
Source name:
World Development Indicators
Source organization:
World Bank national accounts data, and OECD National Accounts data files.
Categories, topics:
Economy & Growth, Trade
Last updated:
apr 23, 2017
Indicators value changes by year
Minimum:
12.984
jan 1, 1986
Maximum:
42.333
jan 1, 2008
At the date of observation
Value
Absolute change
Change from previous value
jan 1, 1961
14.536
+14.536
0.0%
jan 1, 1962
13.495
-1.041
-7.16%
jan 1, 1963
13.423
-0.072
-0.54%
jan 1, 1964
15.933
+2.51
18.7%
jan 1, 1965
18.089
+2.157
13.54%
jan 1, 1966
19.611
+1.521
8.41%
jan 1, 1967
19.134
-0.477
-2.43%
jan 1, 1968
19.512
+0.377
1.97%
jan 1, 1969
18.417
-1.095
-5.61%
jan 1, 1970
17.43
-0.986
-5.36%
jan 1, 1971
17.778
+0.348
2.0%
jan 1, 1972
18.697
+0.919
5.17%
jan 1, 1973
18.536
-0.161
-0.86%
jan 1, 1974
20.205
+1.669
9.0%
jan 1, 1975
25.665
+5.46
27.02%
jan 1, 1976
23.533
-2.132
-8.31%
jan 1, 1977
27.583
+4.05
17.21%
jan 1, 1978
26.257
-1.327
-4.81%
jan 1, 1979
27.263
+1.006
3.83%
jan 1, 1980
25.851
-1.411
-5.18%
jan 1, 1981
24.919
-0.932
-3.61%
jan 1, 1982
23.602
-1.318
-5.29%
jan 1, 1983
18.688
-4.914
-20.82%
jan 1, 1984
14.552
-4.135
-22.13%
jan 1, 1985
15.151
+0.599
4.11%
jan 1, 1986
12.984
-2.167
-14.3%
jan 1, 1987
14.592
+1.608
12.39%
jan 1, 1988
22.294
+7.702
52.78%
jan 1, 1989
21.936
-0.358
-1.6%
jan 1, 1990
22.474
+0.538
2.45%
jan 1, 1991
24.842
+2.368
10.54%
jan 1, 1992
21.568
-3.274
-13.18%
jan 1, 1993
27.296
+5.729
26.56%
jan 1, 1994
26.076
-1.22
-4.47%
jan 1, 1995
24.851
-1.225
-4.7%
jan 1, 1996
25.43
+0.579
2.33%
jan 1, 1997
22.583
-2.848
-11.2%
jan 1, 1998
23.596
+1.013
4.49%
jan 1, 1999
26.252
+2.656
11.26%
jan 1, 2000
27.356
+1.103
4.2%
jan 1, 2001
28.951
+1.595
5.83%
jan 1, 2002
41.337
+12.387
42.79%
jan 1, 2003
39.733
-1.604
-3.88%
jan 1, 2004
40.186
+0.453
1.14%
jan 1, 2005
42.103
+1.917
4.77%
jan 1, 2006
40.994
-1.109
-2.63%
jan 1, 2007
41.886
+0.892
2.18%
jan 1, 2008
42.333
+0.447
1.07%
jan 1, 2009
39.407
-2.926
-6.91%
jan 1, 2010
33.131
-6.276
-15.93%
jan 1, 2011
36.309
+3.179
9.59%
jan 1, 2012
37.359
+1.05
2.89%
jan 1, 2013
36.114
-1.245
-3.33%
jan 1, 2014
34.829
-1.285
-3.56%
jan 1, 2015
33.559
-1.269
-3.64%
jan 1, 2016
30.043
-3.516
-10.48%
Ranking of countries by current statistics by years


Comments: