29
/
en
AIzaSyAYiBZKx7MnpbEhh9jyipgxe19OcubqV5w
April 1, 2024
157406
Iran, Islamic Rep.
IRN
true
2
1
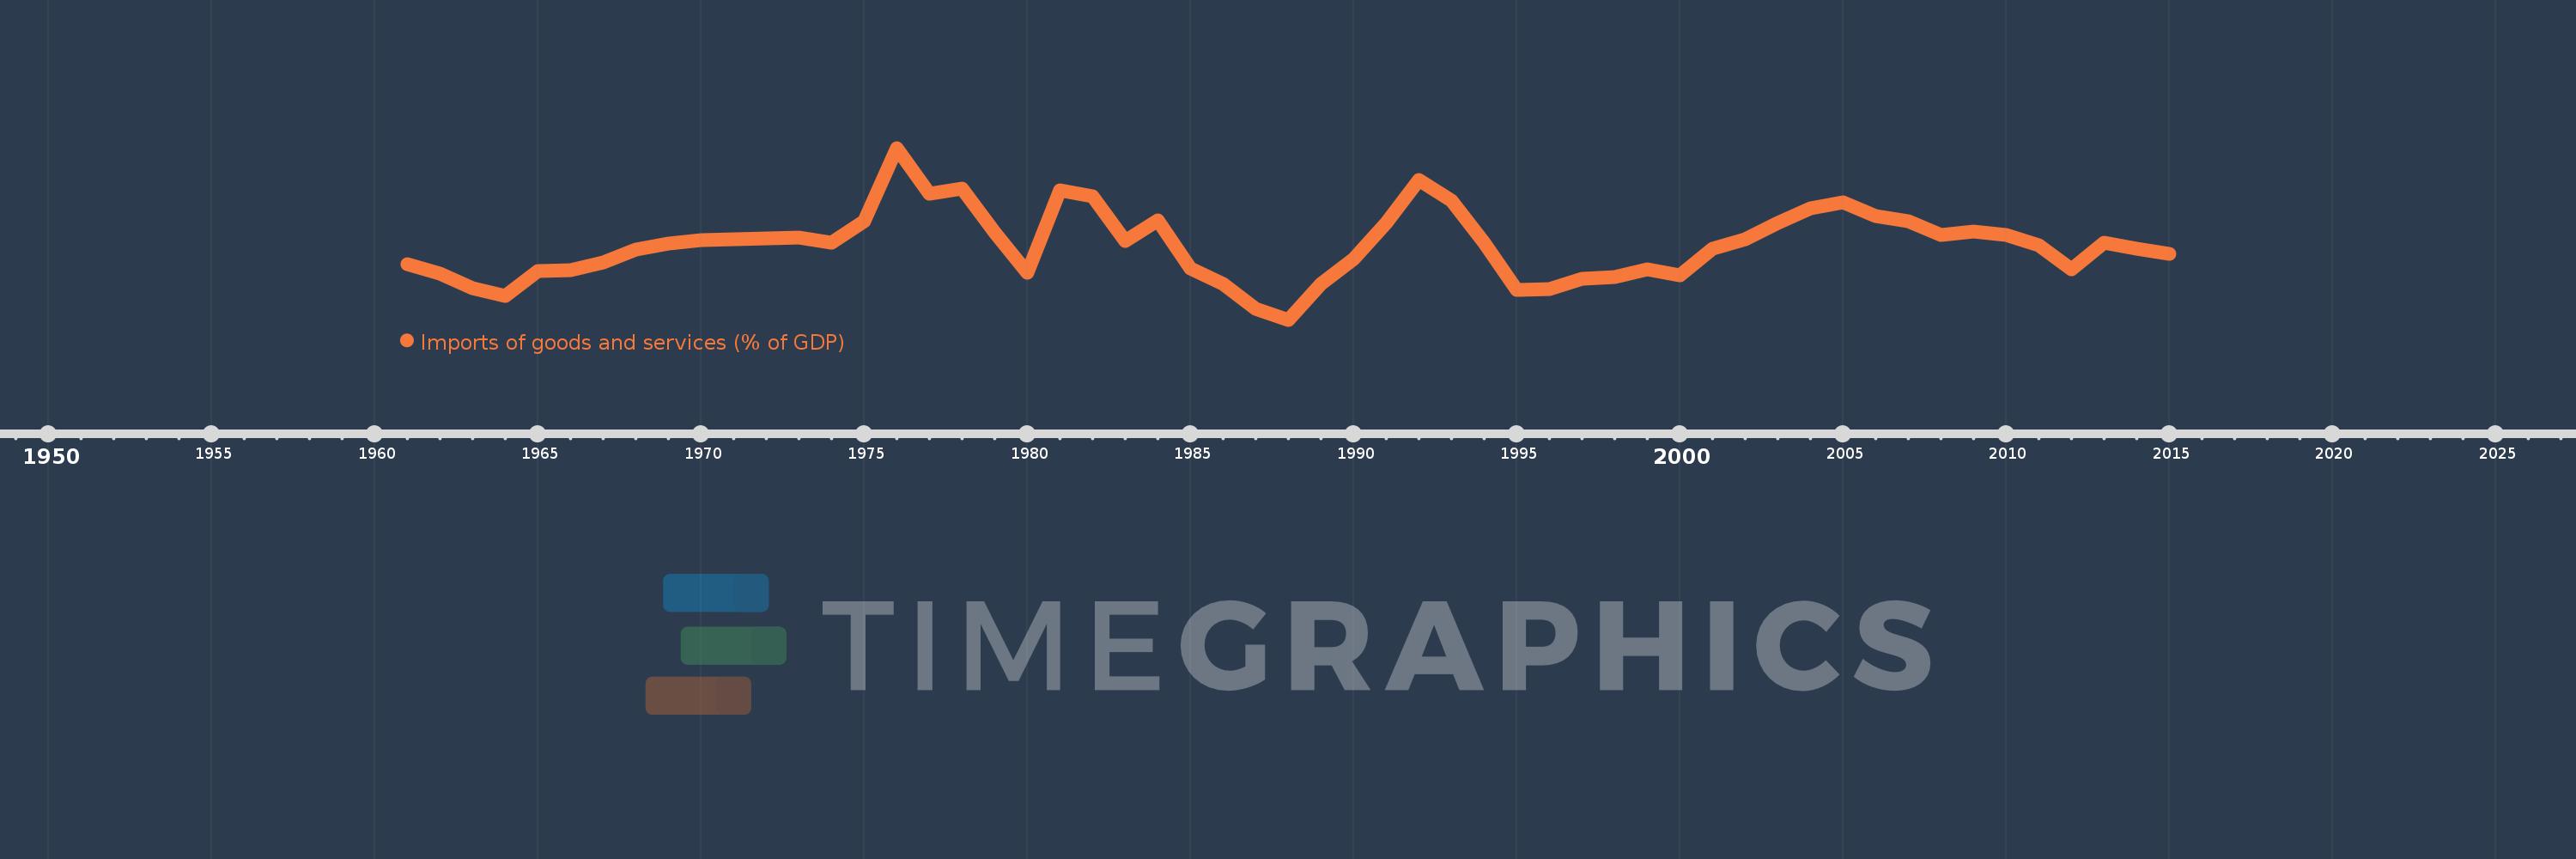
Imports of goods and services (% of GDP)
2015,2014,2013,2012,2011,2010,2009,2008,2007,2006,2005,2004,2003,2002,2001,2000,1999,1998,1997,1996,1995,1994,1993,1992,1991,1990,1989,1988,1987,1986,1985,1984,1983,1982,1981,1980,1979,1978,1977,1976,1975,1974,1973,1972,1971,1970,1969,1968,1967,1966,1965,1964,1963,1962,1961
This statistics in other country:
AfghanistanAlbaniaAlgeriaAngolaAntigua and BarbudaArab WorldArgentinaArmeniaArubaAustraliaAustriaAzerbaijanBahamas, TheBahrainBangladeshBarbadosBelarusBelgiumBelizeBeninBermudaBhutanBoliviaBosnia and HerzegovinaBotswanaBrazilBrunei DarussalamBulgariaBurkina FasoBurundiCabo VerdeCambodiaCameroonCanadaCaribbean small statesCentral African RepublicCentral Europe and the BalticsChadChileChinaColombiaComorosCongo, Dem. Rep.Congo, Rep.Costa RicaCote d'IvoireCroatiaCubaCyprusCzech RepublicDenmarkDjiboutiDominicaDominican RepublicEarly-demographic dividendEast Asia & PacificEast Asia & Pacific (excluding high income)East Asia & Pacific (IDA & IBRD countries)EcuadorEgypt, Arab Rep.El SalvadorEquatorial GuineaEritreaEstoniaEthiopiaEuro areaEurope & Central AsiaEurope & Central Asia (excluding high income)Europe & Central Asia (IDA & IBRD countries)European UnionFaroe IslandsFijiFinlandFragile and conflict affected situationsFranceFrench PolynesiaGabonGambia, TheGeorgiaGermanyGhanaGreeceGrenadaGuatemalaGuineaGuinea-BissauGuyanaHaitiHeavily indebted poor countries (HIPC)High incomeHondurasHong Kong SAR, ChinaHungaryIBRD onlyIcelandIDA & IBRD totalIDA blendIDA onlyIDA totalIndiaIndonesiaIran, Islamic Rep.IraqIrelandIsraelItalyJamaicaJapanJordanKazakhstanKenyaKiribatiKorea, Rep.KosovoKuwaitKyrgyz RepublicLao PDRLate-demographic dividendLatin America & Caribbean Latin America & Caribbean (excluding high income)Latin America & the Caribbean (IDA & IBRD countries)LatviaLeast developed countries: UN classificationLebanonLesothoLiberiaLibyaLithuaniaLow & middle incomeLow incomeLower middle incomeLuxembourgMacao SAR, ChinaMacedonia, FYRMadagascarMalawiMalaysiaMaldivesMaliMaltaMauritaniaMauritiusMexicoMicronesia, Fed. Sts.Middle East & North AfricaMiddle East & North Africa (excluding high income)Middle East & North Africa (IDA & IBRD countries)Middle incomeMoldovaMongoliaMontenegroMoroccoMozambiqueMyanmarNamibiaNepalNetherlandsNew CaledoniaNew ZealandNicaraguaNigerNigeriaNorth AmericaNorwayOECD membersOmanOther small statesPacific island small statesPakistanPalauPanamaPapua New GuineaParaguayPeruPhilippinesPolandPortugalPost-demographic dividendPre-demographic dividendPuerto RicoQatarRomaniaRussian FederationRwandaSamoaSaudi ArabiaSenegalSerbiaSeychellesSierra LeoneSingaporeSlovak RepublicSloveniaSmall statesSolomon IslandsSomaliaSouth AfricaSouth AsiaSouth Asia (IDA & IBRD)South SudanSpainSri LankaSt. Kitts and NevisSt. LuciaSt. Vincent and the GrenadinesSub-Saharan Africa Sub-Saharan Africa (excluding high income)Sub-Saharan Africa (IDA & IBRD countries)SudanSurinameSwazilandSwedenSwitzerlandSyrian Arab RepublicTajikistanTanzaniaThailandTimor-LesteTogoTongaTrinidad and TobagoTunisiaTurkeyTurkmenistanUgandaUkraineUnited Arab EmiratesUnited KingdomUnited StatesUpper middle incomeUruguayUzbekistanVanuatuVenezuela, RBVietnamWest Bank and GazaWorldYemen, Rep.ZambiaZimbabwe Timeline:
This timeline shows a graph from 1961 to 2015 of Iran, Islamic Rep.. No data until 1960. Number of actual observations by date: 55.
Source name:
World Development Indicators
Source organization:
World Bank national accounts data, and OECD National Accounts data files.
Categories, topics:
Economy & Growth, Trade
Last updated:
apr 23, 2017
Indicators value changes by year
At the date of observation
Value
Absolute change
Change from previous value
jan 1, 1961
17.388
+17.388
0.0%
jan 1, 1962
15.863
-1.525
-8.77%
jan 1, 1963
13.679
-2.184
-13.77%
jan 1, 1964
12.46
-1.219
-8.91%
jan 1, 1965
16.33
+3.87
31.06%
jan 1, 1966
16.476
+0.145
0.89%
jan 1, 1967
17.613
+1.137
6.9%
jan 1, 1968
19.659
+2.046
11.62%
jan 1, 1969
20.513
+0.854
4.34%
jan 1, 1970
21.05
+0.537
2.62%
jan 1, 1971
21.201
+0.151
0.72%
jan 1, 1972
21.323
+0.121
0.57%
jan 1, 1973
21.506
+0.183
0.86%
jan 1, 1974
20.658
-0.848
-3.94%
jan 1, 1975
24.034
+3.376
16.34%
jan 1, 1976
35.38
+11.346
47.21%
jan 1, 1977
28.23
-7.15
-20.21%
jan 1, 1978
29.093
+0.863
3.06%
jan 1, 1979
22.22
-6.873
-23.62%
jan 1, 1980
16.059
-6.161
-27.73%
jan 1, 1981
28.747
+12.687
79.0%
jan 1, 1982
27.943
-0.803
-2.79%
jan 1, 1983
20.973
-6.97
-24.94%
jan 1, 1984
24.196
+3.223
15.37%
jan 1, 1985
16.621
-7.576
-31.31%
jan 1, 1986
14.289
-2.332
-14.03%
jan 1, 1987
10.413
-3.876
-27.12%
jan 1, 1988
8.727
-1.686
-16.19%
jan 1, 1989
14.299
+5.571
63.84%
jan 1, 1990
18.108
+3.809
26.64%
jan 1, 1991
23.802
+5.694
31.45%
jan 1, 1992
30.37
+6.568
27.59%
jan 1, 1993
27.233
-3.137
-10.33%
jan 1, 1994
20.631
-6.603
-24.24%
jan 1, 1995
13.323
-7.308
-35.42%
jan 1, 1996
13.468
+0.145
1.09%
jan 1, 1997
15.026
+1.558
11.57%
jan 1, 1998
15.372
+0.345
2.3%
jan 1, 1999
16.545
+1.173
7.63%
jan 1, 2000
15.593
-0.951
-5.75%
jan 1, 2001
19.79
+4.197
26.91%
jan 1, 2002
21.232
+1.442
7.29%
jan 1, 2003
23.759
+2.527
11.9%
jan 1, 2004
26.052
+2.293
9.65%
jan 1, 2005
26.947
+0.895
3.44%
jan 1, 2006
24.834
-2.113
-7.84%
jan 1, 2007
23.988
-0.846
-3.41%
jan 1, 2008
21.817
-2.17
-9.05%
jan 1, 2009
22.478
+0.661
3.03%
jan 1, 2010
21.904
-0.574
-2.55%
jan 1, 2011
20.336
-1.568
-7.16%
jan 1, 2012
16.544
-3.792
-18.65%
jan 1, 2013
20.732
+4.188
25.31%
jan 1, 2014
19.788
-0.944
-4.55%
jan 1, 2015
18.894
-0.894
-4.52%
Ranking of countries by current statistics by years


Comments: