29
/
en
AIzaSyAYiBZKx7MnpbEhh9jyipgxe19OcubqV5w
April 1, 2024
266958
Trinidad and Tobago
TTO
true
2
1
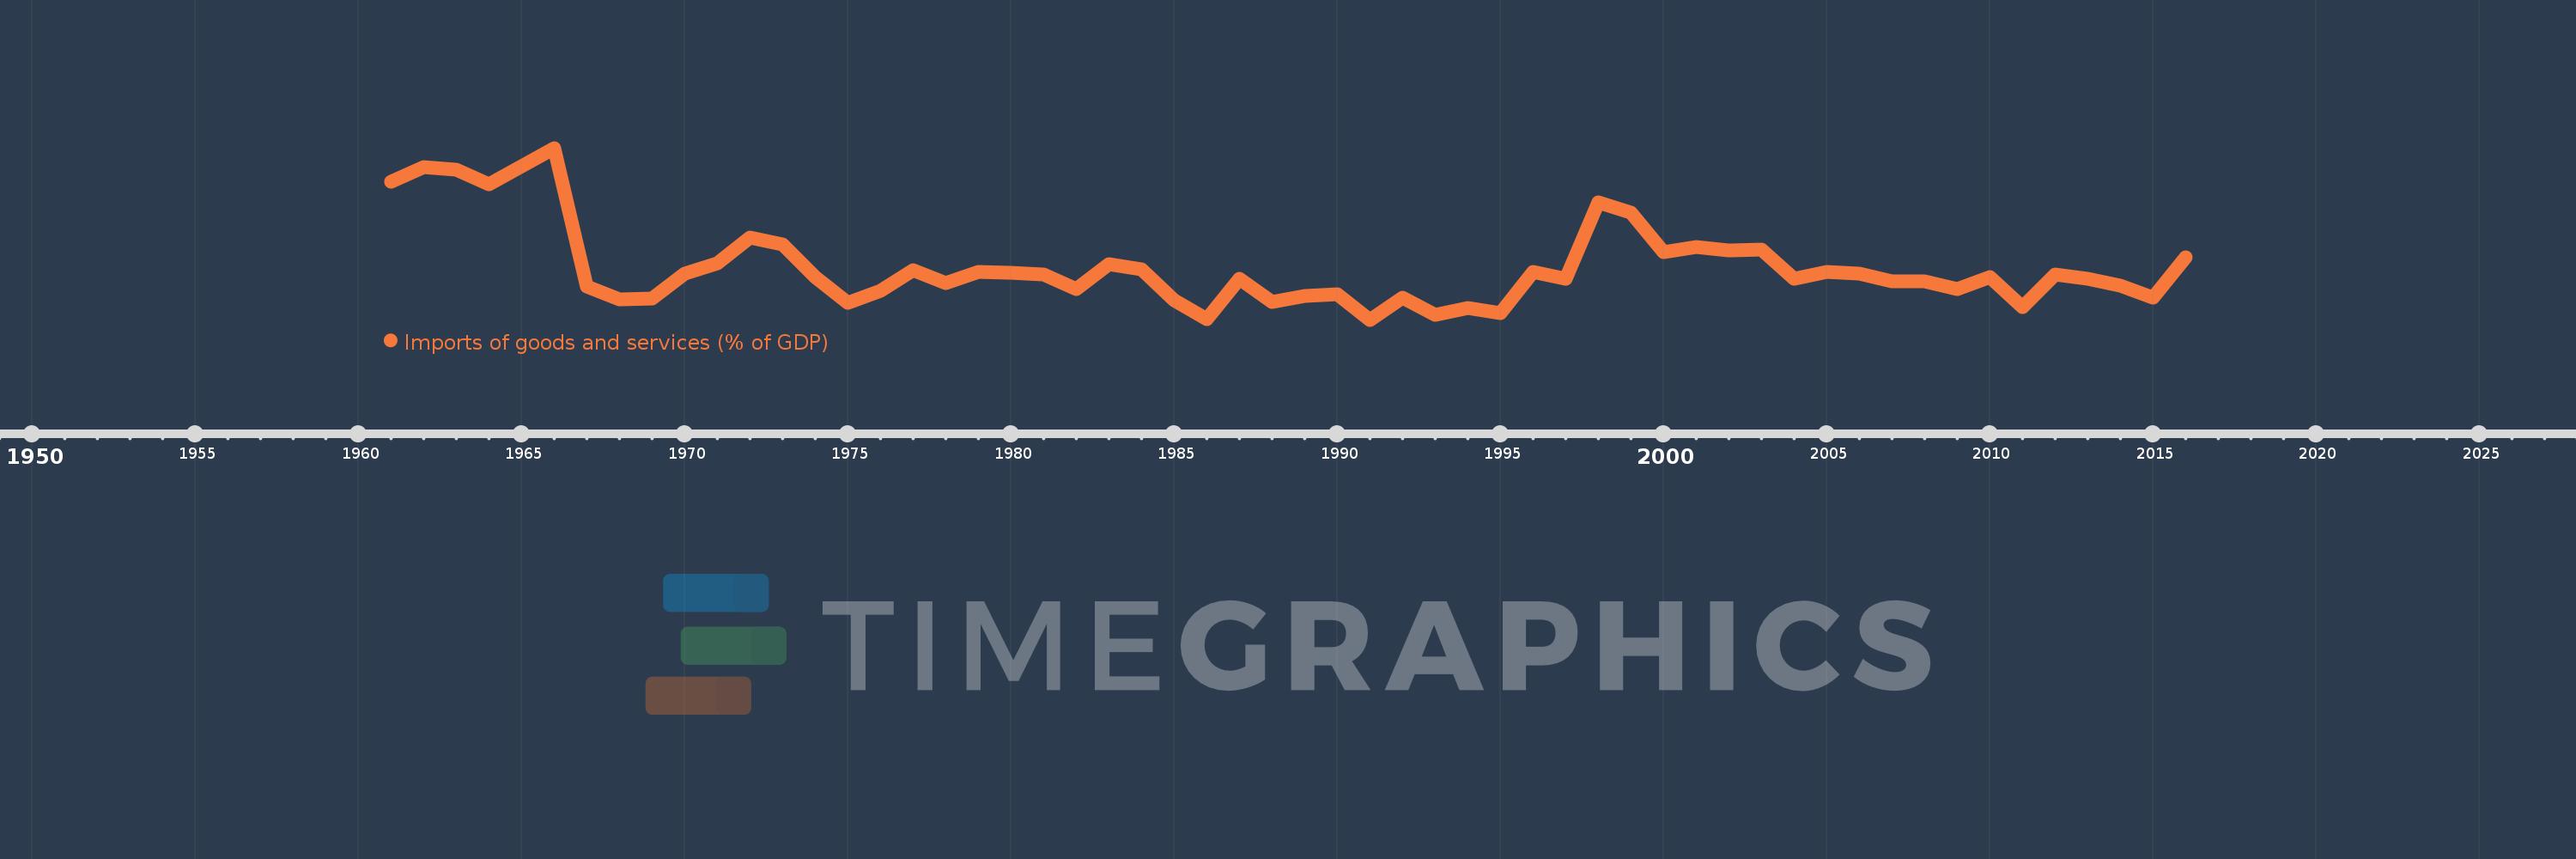
Imports of goods and services (% of GDP)
2016,2015,2014,2013,2012,2011,2010,2009,2008,2007,2006,2005,2004,2003,2002,2001,2000,1999,1998,1997,1996,1995,1994,1993,1992,1991,1990,1989,1988,1987,1986,1985,1984,1983,1982,1981,1980,1979,1978,1977,1976,1975,1974,1973,1972,1971,1970,1969,1968,1967,1966,1965,1964,1963,1962,1961
This statistics in other country:
AfghanistanAlbaniaAlgeriaAngolaAntigua and BarbudaArab WorldArgentinaArmeniaArubaAustraliaAustriaAzerbaijanBahamas, TheBahrainBangladeshBarbadosBelarusBelgiumBelizeBeninBermudaBhutanBoliviaBosnia and HerzegovinaBotswanaBrazilBrunei DarussalamBulgariaBurkina FasoBurundiCabo VerdeCambodiaCameroonCanadaCaribbean small statesCentral African RepublicCentral Europe and the BalticsChadChileChinaColombiaComorosCongo, Dem. Rep.Congo, Rep.Costa RicaCote d'IvoireCroatiaCubaCyprusCzech RepublicDenmarkDjiboutiDominicaDominican RepublicEarly-demographic dividendEast Asia & PacificEast Asia & Pacific (excluding high income)East Asia & Pacific (IDA & IBRD countries)EcuadorEgypt, Arab Rep.El SalvadorEquatorial GuineaEritreaEstoniaEthiopiaEuro areaEurope & Central AsiaEurope & Central Asia (excluding high income)Europe & Central Asia (IDA & IBRD countries)European UnionFaroe IslandsFijiFinlandFragile and conflict affected situationsFranceFrench PolynesiaGabonGambia, TheGeorgiaGermanyGhanaGreeceGrenadaGuatemalaGuineaGuinea-BissauGuyanaHaitiHeavily indebted poor countries (HIPC)High incomeHondurasHong Kong SAR, ChinaHungaryIBRD onlyIcelandIDA & IBRD totalIDA blendIDA onlyIDA totalIndiaIndonesiaIran, Islamic Rep.IraqIrelandIsraelItalyJamaicaJapanJordanKazakhstanKenyaKiribatiKorea, Rep.KosovoKuwaitKyrgyz RepublicLao PDRLate-demographic dividendLatin America & Caribbean Latin America & Caribbean (excluding high income)Latin America & the Caribbean (IDA & IBRD countries)LatviaLeast developed countries: UN classificationLebanonLesothoLiberiaLibyaLithuaniaLow & middle incomeLow incomeLower middle incomeLuxembourgMacao SAR, ChinaMacedonia, FYRMadagascarMalawiMalaysiaMaldivesMaliMaltaMauritaniaMauritiusMexicoMicronesia, Fed. Sts.Middle East & North AfricaMiddle East & North Africa (excluding high income)Middle East & North Africa (IDA & IBRD countries)Middle incomeMoldovaMongoliaMontenegroMoroccoMozambiqueMyanmarNamibiaNepalNetherlandsNew CaledoniaNew ZealandNicaraguaNigerNigeriaNorth AmericaNorwayOECD membersOmanOther small statesPacific island small statesPakistanPalauPanamaPapua New GuineaParaguayPeruPhilippinesPolandPortugalPost-demographic dividendPre-demographic dividendPuerto RicoQatarRomaniaRussian FederationRwandaSamoaSaudi ArabiaSenegalSerbiaSeychellesSierra LeoneSingaporeSlovak RepublicSloveniaSmall statesSolomon IslandsSomaliaSouth AfricaSouth AsiaSouth Asia (IDA & IBRD)South SudanSpainSri LankaSt. Kitts and NevisSt. LuciaSt. Vincent and the GrenadinesSub-Saharan Africa Sub-Saharan Africa (excluding high income)Sub-Saharan Africa (IDA & IBRD countries)SudanSurinameSwazilandSwedenSwitzerlandSyrian Arab RepublicTajikistanTanzaniaThailandTimor-LesteTogoTongaTrinidad and TobagoTunisiaTurkeyTurkmenistanUgandaUkraineUnited Arab EmiratesUnited KingdomUnited StatesUpper middle incomeUruguayUzbekistanVanuatuVenezuela, RBVietnamWest Bank and GazaWorldYemen, Rep.ZambiaZimbabwe Timeline:
This timeline shows a graph from 1961 to 2016 of Trinidad and Tobago. No data until 1960. Number of actual observations by date: 56.
Source name:
World Development Indicators
Source organization:
World Bank national accounts data, and OECD National Accounts data files.
Categories, topics:
Economy & Growth, Trade
Last updated:
apr 23, 2017
Indicators value changes by year
Minimum:
28.158
jan 1, 1991
Maximum:
69.336
jan 1, 1966
At the date of observation
Value
Absolute change
Change from previous value
jan 1, 1961
61.222
+61.222
0.0%
jan 1, 1962
64.709
+3.487
5.7%
jan 1, 1963
64.105
-0.604
-0.93%
jan 1, 1964
60.704
-3.401
-5.31%
jan 1, 1965
64.905
+4.201
6.92%
jan 1, 1966
69.336
+4.431
6.83%
jan 1, 1967
36.06
-33.275
-47.99%
jan 1, 1968
33.087
-2.974
-8.25%
jan 1, 1969
33.331
+0.244
0.74%
jan 1, 1970
39.188
+5.856
17.57%
jan 1, 1971
41.668
+2.481
6.33%
jan 1, 1972
47.899
+6.231
14.95%
jan 1, 1973
46.26
-1.64
-3.42%
jan 1, 1974
38.367
-7.893
-17.06%
jan 1, 1975
32.189
-6.177
-16.1%
jan 1, 1976
35.197
+3.008
9.35%
jan 1, 1977
40.138
+4.94
14.04%
jan 1, 1978
36.896
-3.242
-8.08%
jan 1, 1979
39.659
+2.763
7.49%
jan 1, 1980
39.338
-0.321
-0.81%
jan 1, 1981
39.042
-0.296
-0.75%
jan 1, 1982
35.451
-3.591
-9.2%
jan 1, 1983
41.393
+5.942
16.76%
jan 1, 1984
40.332
-1.062
-2.56%
jan 1, 1985
32.932
-7.399
-18.35%
jan 1, 1986
28.205
-4.727
-14.35%
jan 1, 1987
38.03
+9.825
34.83%
jan 1, 1988
32.336
-5.695
-14.97%
jan 1, 1989
33.763
+1.428
4.42%
jan 1, 1990
34.355
+0.591
1.75%
jan 1, 1991
28.158
-6.197
-18.04%
jan 1, 1992
33.537
+5.379
19.1%
jan 1, 1993
29.291
-4.246
-12.66%
jan 1, 1994
30.986
+1.695
5.79%
jan 1, 1995
29.814
-1.171
-3.78%
jan 1, 1996
39.607
+9.793
32.85%
jan 1, 1997
38.015
-1.592
-4.02%
jan 1, 1998
56.315
+18.3
48.14%
jan 1, 1999
53.855
-2.46
-4.37%
jan 1, 2000
44.458
-9.397
-17.45%
jan 1, 2001
45.495
+1.036
2.33%
jan 1, 2002
44.839
-0.655
-1.44%
jan 1, 2003
45.017
+0.178
0.4%
jan 1, 2004
37.888
-7.129
-15.84%
jan 1, 2005
39.644
+1.757
4.64%
jan 1, 2006
39.205
-0.439
-1.11%
jan 1, 2007
37.453
-1.752
-4.47%
jan 1, 2008
37.26
-0.192
-0.51%
jan 1, 2009
35.531
-1.73
-4.64%
jan 1, 2010
38.398
+2.868
8.07%
jan 1, 2011
31.095
-7.303
-19.02%
jan 1, 2012
39.109
+8.013
25.77%
jan 1, 2013
38.018
-1.09
-2.79%
jan 1, 2014
36.267
-1.752
-4.61%
jan 1, 2015
33.368
-2.899
-7.99%
jan 1, 2016
43.104
+9.736
29.18%
Ranking of countries by current statistics by years


Comments: