29
/
en
AIzaSyAYiBZKx7MnpbEhh9jyipgxe19OcubqV5w
April 1, 2024
77227
Bahrain
BHR
true
2
1
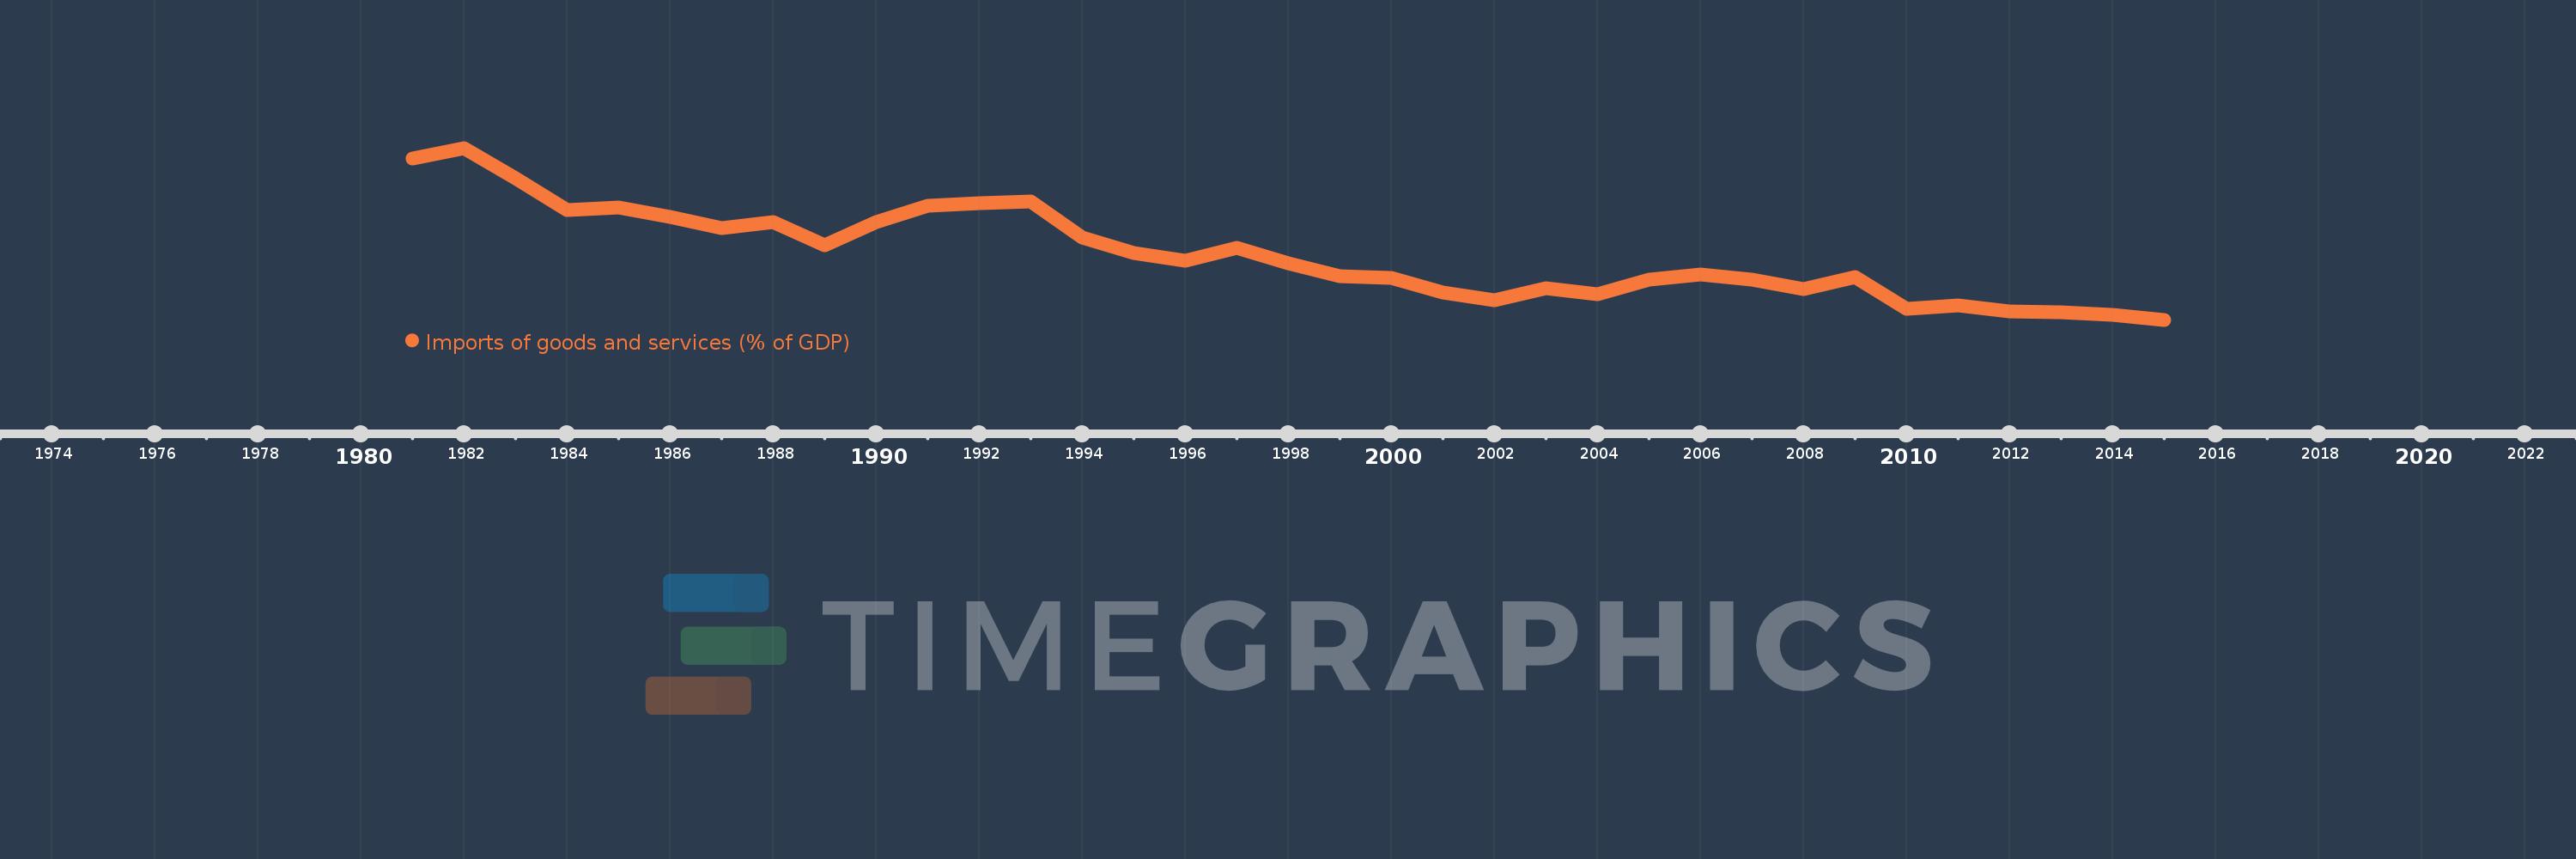
Imports of goods and services (% of GDP)
2015,2014,2013,2012,2011,2010,2009,2008,2007,2006,2005,2004,2003,2002,2001,2000,1999,1998,1997,1996,1995,1994,1993,1992,1991,1990,1989,1988,1987,1986,1985,1984,1983,1982,1981
This statistics in other country:
AfghanistanAlbaniaAlgeriaAngolaAntigua and BarbudaArab WorldArgentinaArmeniaArubaAustraliaAustriaAzerbaijanBahamas, TheBahrainBangladeshBarbadosBelarusBelgiumBelizeBeninBermudaBhutanBoliviaBosnia and HerzegovinaBotswanaBrazilBrunei DarussalamBulgariaBurkina FasoBurundiCabo VerdeCambodiaCameroonCanadaCaribbean small statesCentral African RepublicCentral Europe and the BalticsChadChileChinaColombiaComorosCongo, Dem. Rep.Congo, Rep.Costa RicaCote d'IvoireCroatiaCubaCyprusCzech RepublicDenmarkDjiboutiDominicaDominican RepublicEarly-demographic dividendEast Asia & PacificEast Asia & Pacific (excluding high income)East Asia & Pacific (IDA & IBRD countries)EcuadorEgypt, Arab Rep.El SalvadorEquatorial GuineaEritreaEstoniaEthiopiaEuro areaEurope & Central AsiaEurope & Central Asia (excluding high income)Europe & Central Asia (IDA & IBRD countries)European UnionFaroe IslandsFijiFinlandFragile and conflict affected situationsFranceFrench PolynesiaGabonGambia, TheGeorgiaGermanyGhanaGreeceGrenadaGuatemalaGuineaGuinea-BissauGuyanaHaitiHeavily indebted poor countries (HIPC)High incomeHondurasHong Kong SAR, ChinaHungaryIBRD onlyIcelandIDA & IBRD totalIDA blendIDA onlyIDA totalIndiaIndonesiaIran, Islamic Rep.IraqIrelandIsraelItalyJamaicaJapanJordanKazakhstanKenyaKiribatiKorea, Rep.KosovoKuwaitKyrgyz RepublicLao PDRLate-demographic dividendLatin America & Caribbean Latin America & Caribbean (excluding high income)Latin America & the Caribbean (IDA & IBRD countries)LatviaLeast developed countries: UN classificationLebanonLesothoLiberiaLibyaLithuaniaLow & middle incomeLow incomeLower middle incomeLuxembourgMacao SAR, ChinaMacedonia, FYRMadagascarMalawiMalaysiaMaldivesMaliMaltaMauritaniaMauritiusMexicoMicronesia, Fed. Sts.Middle East & North AfricaMiddle East & North Africa (excluding high income)Middle East & North Africa (IDA & IBRD countries)Middle incomeMoldovaMongoliaMontenegroMoroccoMozambiqueMyanmarNamibiaNepalNetherlandsNew CaledoniaNew ZealandNicaraguaNigerNigeriaNorth AmericaNorwayOECD membersOmanOther small statesPacific island small statesPakistanPalauPanamaPapua New GuineaParaguayPeruPhilippinesPolandPortugalPost-demographic dividendPre-demographic dividendPuerto RicoQatarRomaniaRussian FederationRwandaSamoaSaudi ArabiaSenegalSerbiaSeychellesSierra LeoneSingaporeSlovak RepublicSloveniaSmall statesSolomon IslandsSomaliaSouth AfricaSouth AsiaSouth Asia (IDA & IBRD)South SudanSpainSri LankaSt. Kitts and NevisSt. LuciaSt. Vincent and the GrenadinesSub-Saharan Africa Sub-Saharan Africa (excluding high income)Sub-Saharan Africa (IDA & IBRD countries)SudanSurinameSwazilandSwedenSwitzerlandSyrian Arab RepublicTajikistanTanzaniaThailandTimor-LesteTogoTongaTrinidad and TobagoTunisiaTurkeyTurkmenistanUgandaUkraineUnited Arab EmiratesUnited KingdomUnited StatesUpper middle incomeUruguayUzbekistanVanuatuVenezuela, RBVietnamWest Bank and GazaWorldYemen, Rep.ZambiaZimbabwe Timeline:
This timeline shows a graph from 1981 to 2015 of Bahrain. No data until 1980. Number of actual observations by date: 35.
Source name:
World Development Indicators
Source organization:
World Bank national accounts data, and OECD National Accounts data files.
Categories, topics:
Economy & Growth, Trade
Last updated:
apr 23, 2017
Indicators value changes by year
Minimum:
44.736
jan 1, 2015
Maximum:
120.009
jan 1, 1982
At the date of observation
Value
Absolute change
Change from previous value
jan 1, 1981
115.24
+115.24
0.0%
jan 1, 1982
120.009
+4.769
4.14%
jan 1, 1983
106.777
-13.232
-11.03%
jan 1, 1984
92.951
-13.826
-12.95%
jan 1, 1985
93.844
+0.893
0.96%
jan 1, 1986
89.841
-4.004
-4.27%
jan 1, 1987
84.813
-5.027
-5.6%
jan 1, 1988
87.4
+2.587
3.05%
jan 1, 1989
77.494
-9.906
-11.33%
jan 1, 1990
87.63
+10.135
13.08%
jan 1, 1991
94.605
+6.975
7.96%
jan 1, 1992
95.639
+1.034
1.09%
jan 1, 1993
96.742
+1.103
1.15%
jan 1, 1994
80.729
-16.013
-16.55%
jan 1, 1995
73.985
-6.744
-8.35%
jan 1, 1996
70.474
-3.511
-4.75%
jan 1, 1997
76.202
+5.728
8.13%
jan 1, 1998
69.505
-6.697
-8.79%
jan 1, 1999
63.885
-5.62
-8.09%
jan 1, 2000
62.964
-0.921
-1.44%
jan 1, 2001
56.628
-6.336
-10.06%
jan 1, 2002
53.415
-3.213
-5.67%
jan 1, 2003
58.39
+4.974
9.31%
jan 1, 2004
56.028
-2.361
-4.04%
jan 1, 2005
62.132
+6.104
10.89%
jan 1, 2006
64.419
+2.287
3.68%
jan 1, 2007
62.464
-1.955
-3.04%
jan 1, 2008
58.106
-4.359
-6.98%
jan 1, 2009
63.305
+5.2
8.95%
jan 1, 2010
49.498
-13.807
-21.81%
jan 1, 2011
50.935
+1.437
2.9%
jan 1, 2012
48.249
-2.686
-5.27%
jan 1, 2013
47.869
-0.38
-0.79%
jan 1, 2014
46.764
-1.105
-2.31%
jan 1, 2015
44.736
-2.029
-4.34%
Ranking of countries by current statistics by years


Comments: