29
/
en
AIzaSyAYiBZKx7MnpbEhh9jyipgxe19OcubqV5w
April 1, 2024
164965
Jordan
JOR
true
2
1
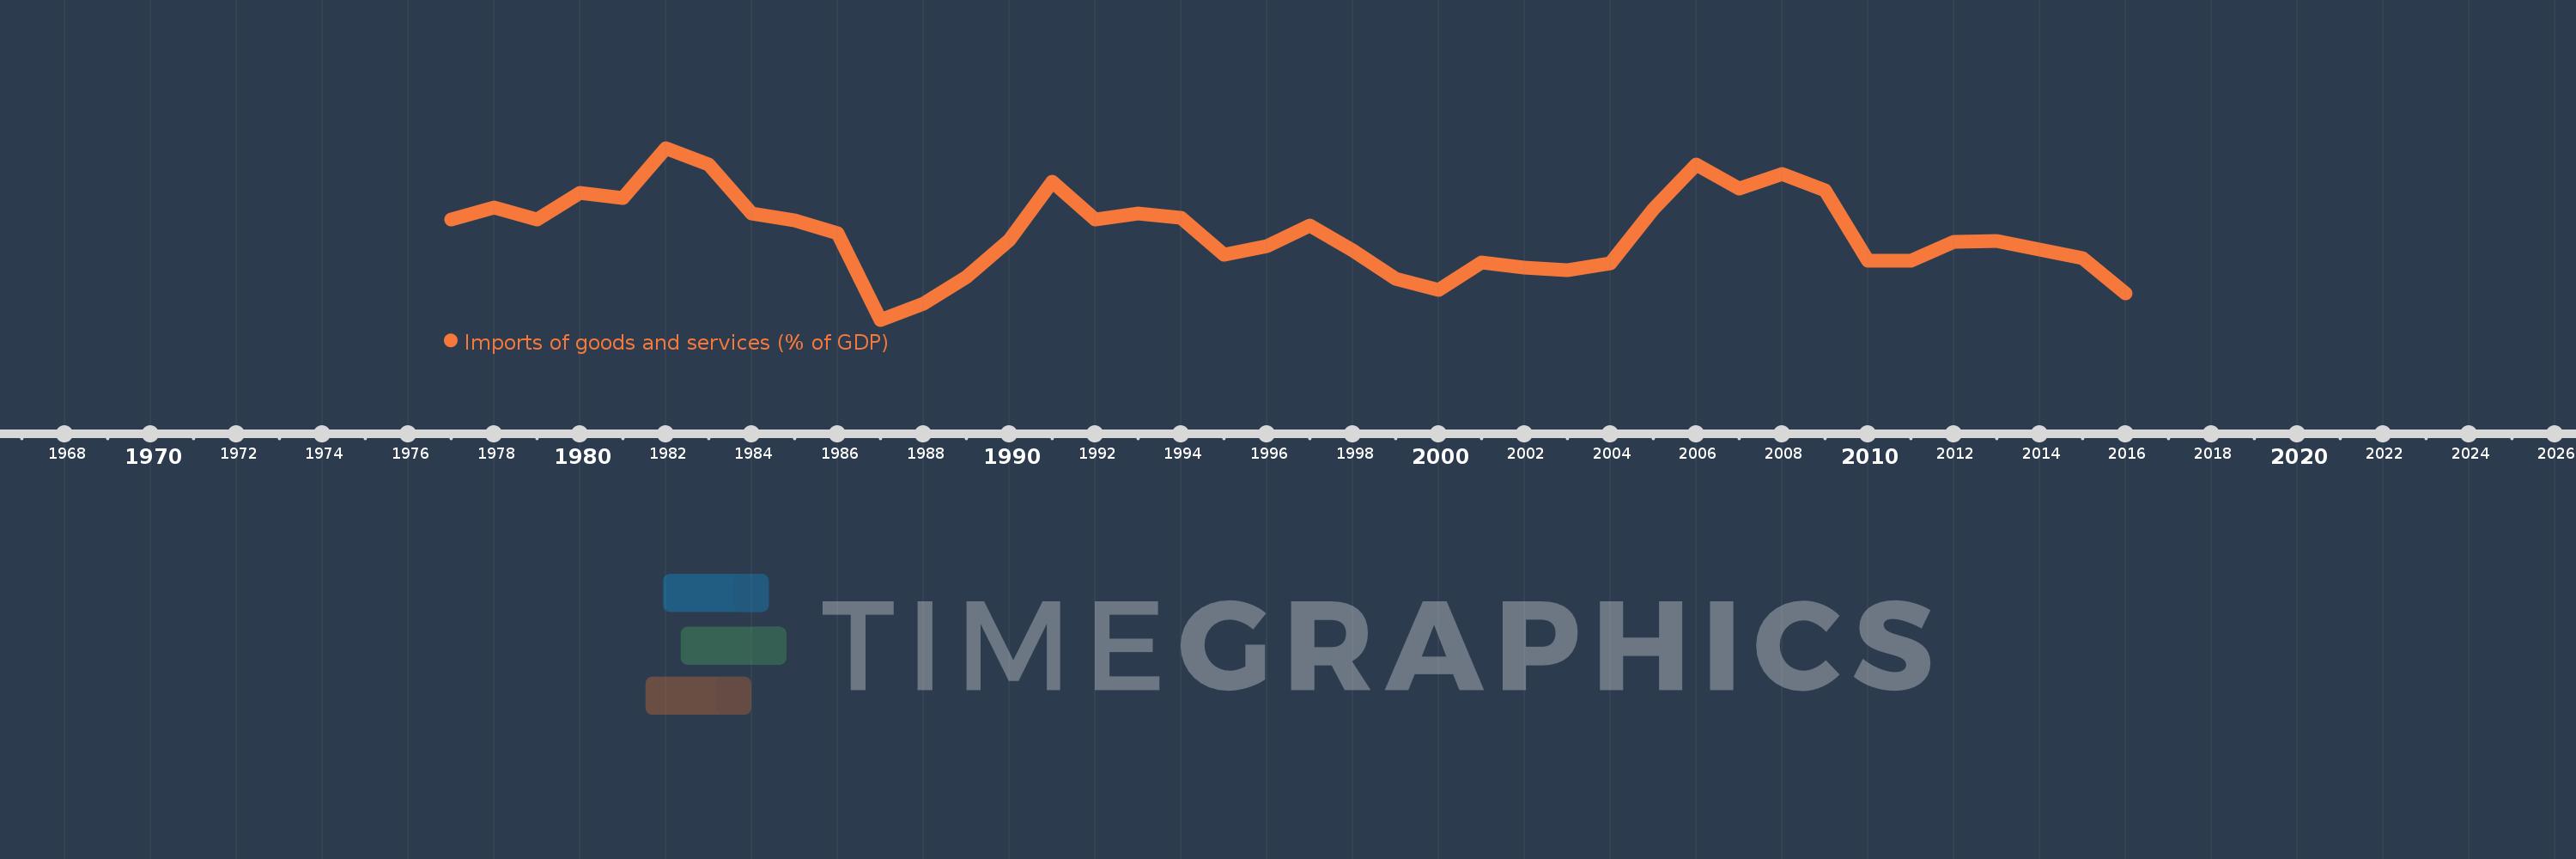
Imports of goods and services (% of GDP)
2016,2015,2014,2013,2012,2011,2010,2009,2008,2007,2006,2005,2004,2003,2002,2001,2000,1999,1998,1997,1996,1995,1994,1993,1992,1991,1990,1989,1988,1987,1986,1985,1984,1983,1982,1981,1980,1979,1978,1977
This statistics in other country:
AfghanistanAlbaniaAlgeriaAngolaAntigua and BarbudaArab WorldArgentinaArmeniaArubaAustraliaAustriaAzerbaijanBahamas, TheBahrainBangladeshBarbadosBelarusBelgiumBelizeBeninBermudaBhutanBoliviaBosnia and HerzegovinaBotswanaBrazilBrunei DarussalamBulgariaBurkina FasoBurundiCabo VerdeCambodiaCameroonCanadaCaribbean small statesCentral African RepublicCentral Europe and the BalticsChadChileChinaColombiaComorosCongo, Dem. Rep.Congo, Rep.Costa RicaCote d'IvoireCroatiaCubaCyprusCzech RepublicDenmarkDjiboutiDominicaDominican RepublicEarly-demographic dividendEast Asia & PacificEast Asia & Pacific (excluding high income)East Asia & Pacific (IDA & IBRD countries)EcuadorEgypt, Arab Rep.El SalvadorEquatorial GuineaEritreaEstoniaEthiopiaEuro areaEurope & Central AsiaEurope & Central Asia (excluding high income)Europe & Central Asia (IDA & IBRD countries)European UnionFaroe IslandsFijiFinlandFragile and conflict affected situationsFranceFrench PolynesiaGabonGambia, TheGeorgiaGermanyGhanaGreeceGrenadaGuatemalaGuineaGuinea-BissauGuyanaHaitiHeavily indebted poor countries (HIPC)High incomeHondurasHong Kong SAR, ChinaHungaryIBRD onlyIcelandIDA & IBRD totalIDA blendIDA onlyIDA totalIndiaIndonesiaIran, Islamic Rep.IraqIrelandIsraelItalyJamaicaJapanJordanKazakhstanKenyaKiribatiKorea, Rep.KosovoKuwaitKyrgyz RepublicLao PDRLate-demographic dividendLatin America & Caribbean Latin America & Caribbean (excluding high income)Latin America & the Caribbean (IDA & IBRD countries)LatviaLeast developed countries: UN classificationLebanonLesothoLiberiaLibyaLithuaniaLow & middle incomeLow incomeLower middle incomeLuxembourgMacao SAR, ChinaMacedonia, FYRMadagascarMalawiMalaysiaMaldivesMaliMaltaMauritaniaMauritiusMexicoMicronesia, Fed. Sts.Middle East & North AfricaMiddle East & North Africa (excluding high income)Middle East & North Africa (IDA & IBRD countries)Middle incomeMoldovaMongoliaMontenegroMoroccoMozambiqueMyanmarNamibiaNepalNetherlandsNew CaledoniaNew ZealandNicaraguaNigerNigeriaNorth AmericaNorwayOECD membersOmanOther small statesPacific island small statesPakistanPalauPanamaPapua New GuineaParaguayPeruPhilippinesPolandPortugalPost-demographic dividendPre-demographic dividendPuerto RicoQatarRomaniaRussian FederationRwandaSamoaSaudi ArabiaSenegalSerbiaSeychellesSierra LeoneSingaporeSlovak RepublicSloveniaSmall statesSolomon IslandsSomaliaSouth AfricaSouth AsiaSouth Asia (IDA & IBRD)South SudanSpainSri LankaSt. Kitts and NevisSt. LuciaSt. Vincent and the GrenadinesSub-Saharan Africa Sub-Saharan Africa (excluding high income)Sub-Saharan Africa (IDA & IBRD countries)SudanSurinameSwazilandSwedenSwitzerlandSyrian Arab RepublicTajikistanTanzaniaThailandTimor-LesteTogoTongaTrinidad and TobagoTunisiaTurkeyTurkmenistanUgandaUkraineUnited Arab EmiratesUnited KingdomUnited StatesUpper middle incomeUruguayUzbekistanVanuatuVenezuela, RBVietnamWest Bank and GazaWorldYemen, Rep.ZambiaZimbabwe Timeline:
This timeline shows a graph from 1977 to 2016 of Jordan. No data until 1976. Number of actual observations by date: 40.
Source name:
World Development Indicators
Source organization:
World Bank national accounts data, and OECD National Accounts data files.
Categories, topics:
Economy & Growth, Trade
Last updated:
apr 23, 2017
Indicators value changes by year
Minimum:
53.538
jan 1, 1987
Maximum:
98.537
jan 1, 1982
At the date of observation
Value
Absolute change
Change from previous value
jan 1, 1977
79.764
+79.764
0.0%
jan 1, 1978
82.908
+3.145
3.94%
jan 1, 1979
79.821
-3.087
-3.72%
jan 1, 1980
86.738
+6.916
8.66%
jan 1, 1981
85.311
-1.427
-1.65%
jan 1, 1982
98.537
+13.226
15.5%
jan 1, 1983
94.291
-4.246
-4.31%
jan 1, 1984
81.339
-12.952
-13.74%
jan 1, 1985
79.547
-1.792
-2.2%
jan 1, 1986
76.257
-3.289
-4.13%
jan 1, 1987
53.538
-22.72
-29.79%
jan 1, 1988
57.71
+4.173
7.79%
jan 1, 1989
64.68
+6.97
12.08%
jan 1, 1990
74.401
+9.721
15.03%
jan 1, 1991
89.616
+15.215
20.45%
jan 1, 1992
79.872
-9.745
-10.87%
jan 1, 1993
81.407
+1.535
1.92%
jan 1, 1994
80.152
-1.254
-1.54%
jan 1, 1995
70.458
-9.695
-12.1%
jan 1, 1996
72.863
+2.405
3.41%
jan 1, 1997
78.171
+5.307
7.28%
jan 1, 1998
71.583
-6.588
-8.43%
jan 1, 1999
64.342
-7.241
-10.12%
jan 1, 2000
61.246
-3.096
-4.81%
jan 1, 2001
68.525
+7.279
11.89%
jan 1, 2002
67.169
-1.356
-1.98%
jan 1, 2003
66.632
-0.537
-0.8%
jan 1, 2004
68.35
+1.718
2.58%
jan 1, 2005
82.462
+14.112
20.65%
jan 1, 2006
94.207
+11.745
14.24%
jan 1, 2007
87.873
-6.333
-6.72%
jan 1, 2008
91.758
+3.885
4.42%
jan 1, 2009
87.511
-4.247
-4.63%
jan 1, 2010
69.101
-18.411
-21.04%
jan 1, 2011
69.03
-0.071
-0.1%
jan 1, 2012
73.859
+4.829
7.0%
jan 1, 2013
74.265
+0.406
0.55%
jan 1, 2014
71.954
-2.311
-3.11%
jan 1, 2015
69.738
-2.216
-3.08%
jan 1, 2016
60.49
-9.248
-13.26%
Ranking of countries by current statistics by years


Comments: