29
/
en
AIzaSyAYiBZKx7MnpbEhh9jyipgxe19OcubqV5w
April 1, 2024
183031
Macao SAR, China
MAC
true
2
1
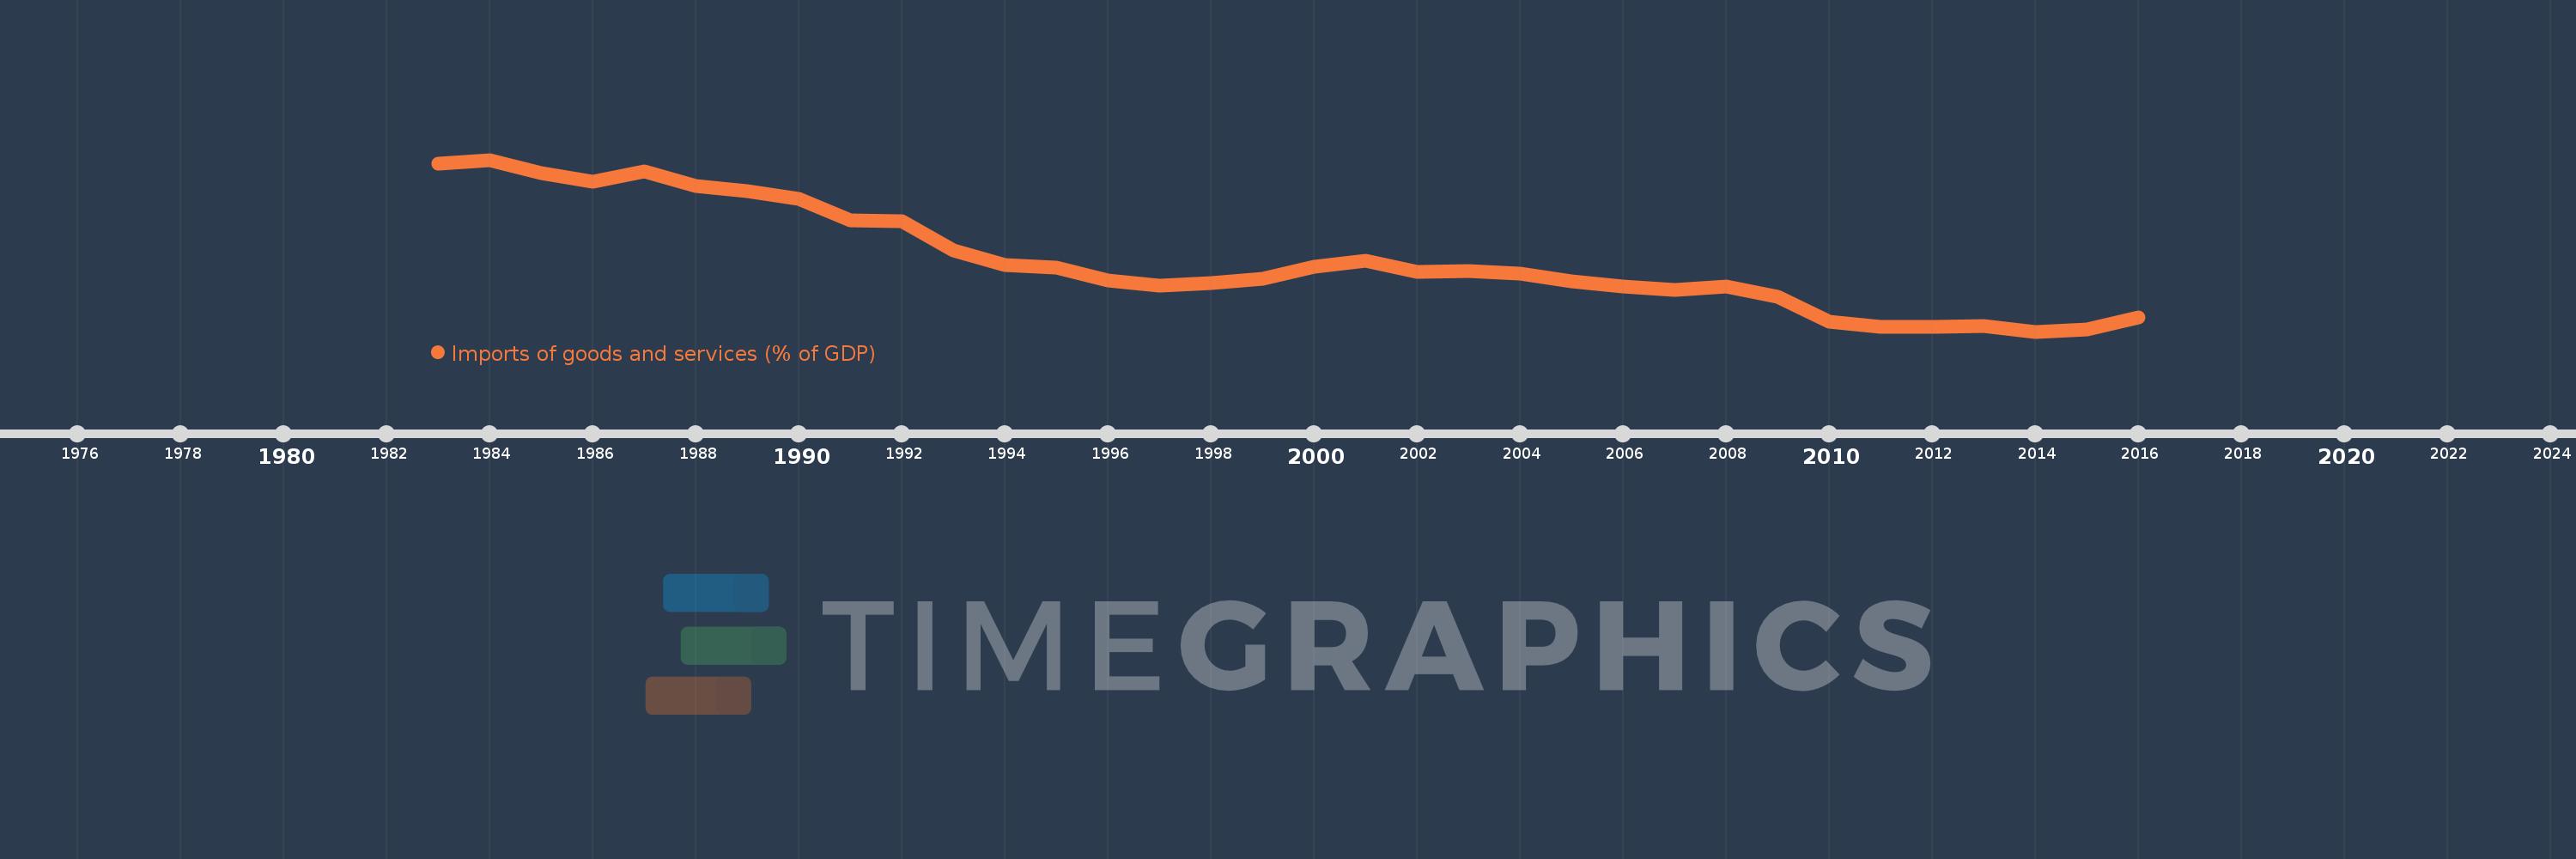
Imports of goods and services (% of GDP)
2016,2015,2014,2013,2012,2011,2010,2009,2008,2007,2006,2005,2004,2003,2002,2001,2000,1999,1998,1997,1996,1995,1994,1993,1992,1991,1990,1989,1988,1987,1986,1985,1984,1983
This statistics in other country:
AfghanistanAlbaniaAlgeriaAngolaAntigua and BarbudaArab WorldArgentinaArmeniaArubaAustraliaAustriaAzerbaijanBahamas, TheBahrainBangladeshBarbadosBelarusBelgiumBelizeBeninBermudaBhutanBoliviaBosnia and HerzegovinaBotswanaBrazilBrunei DarussalamBulgariaBurkina FasoBurundiCabo VerdeCambodiaCameroonCanadaCaribbean small statesCentral African RepublicCentral Europe and the BalticsChadChileChinaColombiaComorosCongo, Dem. Rep.Congo, Rep.Costa RicaCote d'IvoireCroatiaCubaCyprusCzech RepublicDenmarkDjiboutiDominicaDominican RepublicEarly-demographic dividendEast Asia & PacificEast Asia & Pacific (excluding high income)East Asia & Pacific (IDA & IBRD countries)EcuadorEgypt, Arab Rep.El SalvadorEquatorial GuineaEritreaEstoniaEthiopiaEuro areaEurope & Central AsiaEurope & Central Asia (excluding high income)Europe & Central Asia (IDA & IBRD countries)European UnionFaroe IslandsFijiFinlandFragile and conflict affected situationsFranceFrench PolynesiaGabonGambia, TheGeorgiaGermanyGhanaGreeceGrenadaGuatemalaGuineaGuinea-BissauGuyanaHaitiHeavily indebted poor countries (HIPC)High incomeHondurasHong Kong SAR, ChinaHungaryIBRD onlyIcelandIDA & IBRD totalIDA blendIDA onlyIDA totalIndiaIndonesiaIran, Islamic Rep.IraqIrelandIsraelItalyJamaicaJapanJordanKazakhstanKenyaKiribatiKorea, Rep.KosovoKuwaitKyrgyz RepublicLao PDRLate-demographic dividendLatin America & Caribbean Latin America & Caribbean (excluding high income)Latin America & the Caribbean (IDA & IBRD countries)LatviaLeast developed countries: UN classificationLebanonLesothoLiberiaLibyaLithuaniaLow & middle incomeLow incomeLower middle incomeLuxembourgMacao SAR, ChinaMacedonia, FYRMadagascarMalawiMalaysiaMaldivesMaliMaltaMauritaniaMauritiusMexicoMicronesia, Fed. Sts.Middle East & North AfricaMiddle East & North Africa (excluding high income)Middle East & North Africa (IDA & IBRD countries)Middle incomeMoldovaMongoliaMontenegroMoroccoMozambiqueMyanmarNamibiaNepalNetherlandsNew CaledoniaNew ZealandNicaraguaNigerNigeriaNorth AmericaNorwayOECD membersOmanOther small statesPacific island small statesPakistanPalauPanamaPapua New GuineaParaguayPeruPhilippinesPolandPortugalPost-demographic dividendPre-demographic dividendPuerto RicoQatarRomaniaRussian FederationRwandaSamoaSaudi ArabiaSenegalSerbiaSeychellesSierra LeoneSingaporeSlovak RepublicSloveniaSmall statesSolomon IslandsSomaliaSouth AfricaSouth AsiaSouth Asia (IDA & IBRD)South SudanSpainSri LankaSt. Kitts and NevisSt. LuciaSt. Vincent and the GrenadinesSub-Saharan Africa Sub-Saharan Africa (excluding high income)Sub-Saharan Africa (IDA & IBRD countries)SudanSurinameSwazilandSwedenSwitzerlandSyrian Arab RepublicTajikistanTanzaniaThailandTimor-LesteTogoTongaTrinidad and TobagoTunisiaTurkeyTurkmenistanUgandaUkraineUnited Arab EmiratesUnited KingdomUnited StatesUpper middle incomeUruguayUzbekistanVanuatuVenezuela, RBVietnamWest Bank and GazaWorldYemen, Rep.ZambiaZimbabwe Timeline:
This timeline shows a graph from 1983 to 2016 of Macao SAR, China. No data until 1982. Number of actual observations by date: 34.
Source name:
World Development Indicators
Source organization:
World Bank national accounts data, and OECD National Accounts data files.
Categories, topics:
Economy & Growth, Trade
Last updated:
apr 23, 2017
Indicators value changes by year
Minimum:
30.405
jan 1, 2014
Maximum:
113.218
jan 1, 1984
At the date of observation
Value
Absolute change
Change from previous value
jan 1, 1983
111.177
+111.177
0.0%
jan 1, 1984
113.218
+2.041
1.84%
jan 1, 1985
106.965
-6.253
-5.52%
jan 1, 1986
102.779
-4.186
-3.91%
jan 1, 1987
107.507
+4.728
4.6%
jan 1, 1988
100.439
-7.068
-6.57%
jan 1, 1989
98.043
-2.397
-2.39%
jan 1, 1990
94.448
-3.594
-3.67%
jan 1, 1991
83.972
-10.476
-11.09%
jan 1, 1992
83.483
-0.489
-0.58%
jan 1, 1993
69.715
-13.768
-16.49%
jan 1, 1994
62.7
-7.015
-10.06%
jan 1, 1995
61.142
-1.558
-2.48%
jan 1, 1996
55.21
-5.932
-9.7%
jan 1, 1997
52.389
-2.821
-5.11%
jan 1, 1998
53.839
+1.45
2.77%
jan 1, 1999
55.851
+2.012
3.74%
jan 1, 2000
61.774
+5.923
10.6%
jan 1, 2001
64.631
+2.857
4.62%
jan 1, 2002
59.222
-5.409
-8.37%
jan 1, 2003
59.514
+0.293
0.49%
jan 1, 2004
58.293
-1.222
-2.05%
jan 1, 2005
54.428
-3.865
-6.63%
jan 1, 2006
52.277
-2.151
-3.95%
jan 1, 2007
50.527
-1.75
-3.35%
jan 1, 2008
52.069
+1.541
3.05%
jan 1, 2009
47.158
-4.91
-9.43%
jan 1, 2010
35.228
-11.93
-25.3%
jan 1, 2011
32.654
-2.574
-7.31%
jan 1, 2012
32.67
+0.016
0.05%
jan 1, 2013
33.064
+0.394
1.2%
jan 1, 2014
30.405
-2.659
-8.04%
jan 1, 2015
31.306
+0.902
2.97%
jan 1, 2016
37.132
+5.826
18.61%
Ranking of countries by current statistics by years


Comments: