29
/
en
AIzaSyAYiBZKx7MnpbEhh9jyipgxe19OcubqV5w
April 1, 2024
41539
Latin America & Caribbean
LCN
false
2
1
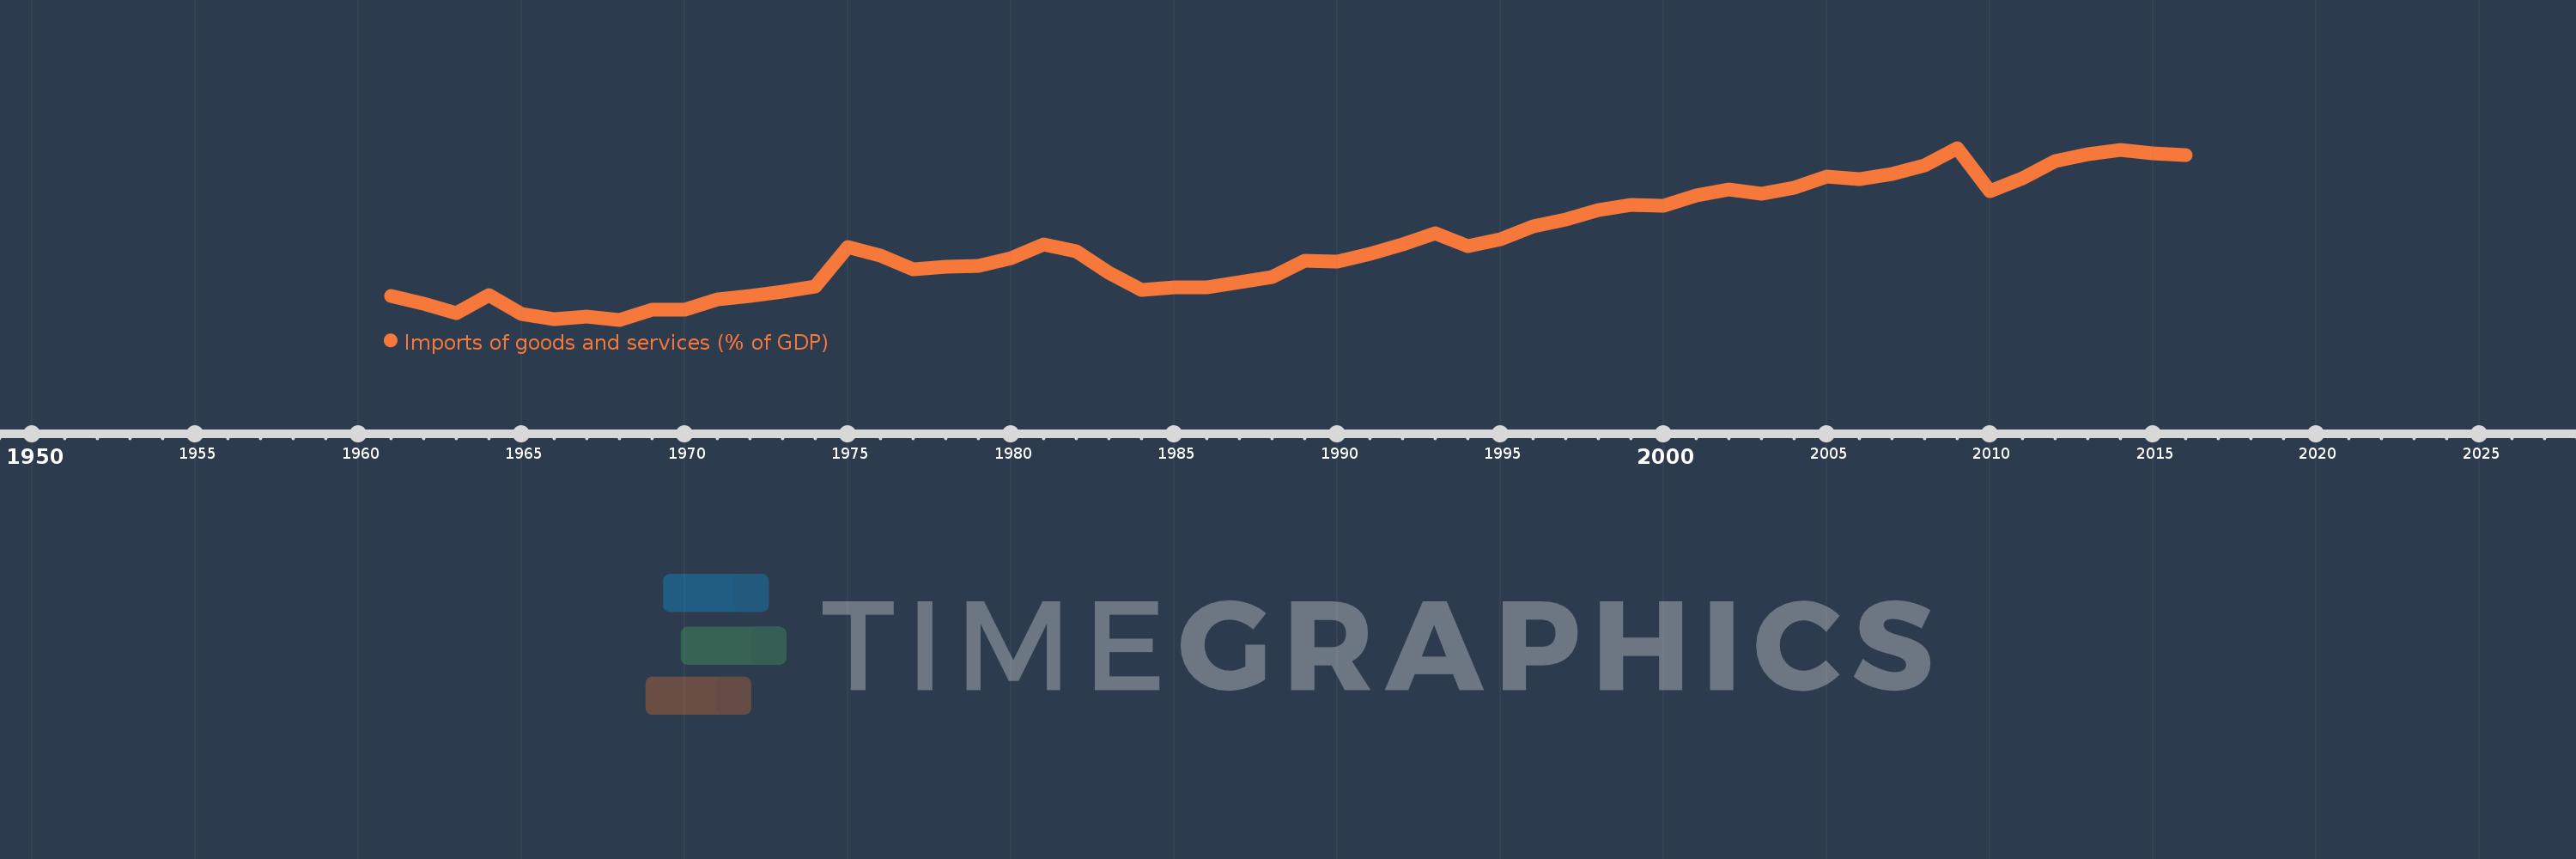
Imports of goods and services (% of GDP)
2016,2015,2014,2013,2012,2011,2010,2009,2008,2007,2006,2005,2004,2003,2002,2001,2000,1999,1998,1997,1996,1995,1994,1993,1992,1991,1990,1989,1988,1987,1986,1985,1984,1983,1982,1981,1980,1979,1978,1977,1976,1975,1974,1973,1972,1971,1970,1969,1968,1967,1966,1965,1964,1963,1962,1961
This statistics in other country:
AfghanistanAlbaniaAlgeriaAngolaAntigua and BarbudaArab WorldArgentinaArmeniaArubaAustraliaAustriaAzerbaijanBahamas, TheBahrainBangladeshBarbadosBelarusBelgiumBelizeBeninBermudaBhutanBoliviaBosnia and HerzegovinaBotswanaBrazilBrunei DarussalamBulgariaBurkina FasoBurundiCabo VerdeCambodiaCameroonCanadaCaribbean small statesCentral African RepublicCentral Europe and the BalticsChadChileChinaColombiaComorosCongo, Dem. Rep.Congo, Rep.Costa RicaCote d'IvoireCroatiaCubaCyprusCzech RepublicDenmarkDjiboutiDominicaDominican RepublicEarly-demographic dividendEast Asia & PacificEast Asia & Pacific (excluding high income)East Asia & Pacific (IDA & IBRD countries)EcuadorEgypt, Arab Rep.El SalvadorEquatorial GuineaEritreaEstoniaEthiopiaEuro areaEurope & Central AsiaEurope & Central Asia (excluding high income)Europe & Central Asia (IDA & IBRD countries)European UnionFaroe IslandsFijiFinlandFragile and conflict affected situationsFranceFrench PolynesiaGabonGambia, TheGeorgiaGermanyGhanaGreeceGrenadaGuatemalaGuineaGuinea-BissauGuyanaHaitiHeavily indebted poor countries (HIPC)High incomeHondurasHong Kong SAR, ChinaHungaryIBRD onlyIcelandIDA & IBRD totalIDA blendIDA onlyIDA totalIndiaIndonesiaIran, Islamic Rep.IraqIrelandIsraelItalyJamaicaJapanJordanKazakhstanKenyaKiribatiKorea, Rep.KosovoKuwaitKyrgyz RepublicLao PDRLate-demographic dividendLatin America & Caribbean Latin America & Caribbean (excluding high income)Latin America & the Caribbean (IDA & IBRD countries)LatviaLeast developed countries: UN classificationLebanonLesothoLiberiaLibyaLithuaniaLow & middle incomeLow incomeLower middle incomeLuxembourgMacao SAR, ChinaMacedonia, FYRMadagascarMalawiMalaysiaMaldivesMaliMaltaMauritaniaMauritiusMexicoMicronesia, Fed. Sts.Middle East & North AfricaMiddle East & North Africa (excluding high income)Middle East & North Africa (IDA & IBRD countries)Middle incomeMoldovaMongoliaMontenegroMoroccoMozambiqueMyanmarNamibiaNepalNetherlandsNew CaledoniaNew ZealandNicaraguaNigerNigeriaNorth AmericaNorwayOECD membersOmanOther small statesPacific island small statesPakistanPalauPanamaPapua New GuineaParaguayPeruPhilippinesPolandPortugalPost-demographic dividendPre-demographic dividendPuerto RicoQatarRomaniaRussian FederationRwandaSamoaSaudi ArabiaSenegalSerbiaSeychellesSierra LeoneSingaporeSlovak RepublicSloveniaSmall statesSolomon IslandsSomaliaSouth AfricaSouth AsiaSouth Asia (IDA & IBRD)South SudanSpainSri LankaSt. Kitts and NevisSt. LuciaSt. Vincent and the GrenadinesSub-Saharan Africa Sub-Saharan Africa (excluding high income)Sub-Saharan Africa (IDA & IBRD countries)SudanSurinameSwazilandSwedenSwitzerlandSyrian Arab RepublicTajikistanTanzaniaThailandTimor-LesteTogoTongaTrinidad and TobagoTunisiaTurkeyTurkmenistanUgandaUkraineUnited Arab EmiratesUnited KingdomUnited StatesUpper middle incomeUruguayUzbekistanVanuatuVenezuela, RBVietnamWest Bank and GazaWorldYemen, Rep.ZambiaZimbabwe Timeline:
This timeline shows a graph from 1961 to 2016 of Latin America & Caribbean . No data until 1960. Number of actual observations by date: 56.
Source name:
World Development Indicators
Source organization:
World Bank national accounts data, and OECD National Accounts data files.
Categories, topics:
Economy & Growth, Trade
Last updated:
apr 23, 2017
Indicators value changes by year
Minimum:
10.402
jan 1, 1968
Maximum:
23.459
jan 1, 2009
At the date of observation
Value
Absolute change
Change from previous value
jan 1, 1961
12.195
+12.195
0.0%
jan 1, 1962
11.636
-0.559
-4.58%
jan 1, 1963
10.918
-0.718
-6.17%
jan 1, 1964
12.285
+1.367
12.52%
jan 1, 1965
10.813
-1.471
-11.98%
jan 1, 1966
10.439
-0.374
-3.46%
jan 1, 1967
10.657
+0.217
2.08%
jan 1, 1968
10.402
-0.255
-2.39%
jan 1, 1969
11.135
+0.733
7.05%
jan 1, 1970
11.171
+0.036
0.33%
jan 1, 1971
11.953
+0.782
7.0%
jan 1, 1972
12.227
+0.274
2.29%
jan 1, 1973
12.53
+0.303
2.48%
jan 1, 1974
12.908
+0.379
3.02%
jan 1, 1975
15.949
+3.041
23.55%
jan 1, 1976
15.28
-0.669
-4.2%
jan 1, 1977
14.26
-1.019
-6.67%
jan 1, 1978
14.429
+0.168
1.18%
jan 1, 1979
14.516
+0.087
0.61%
jan 1, 1980
15.052
+0.536
3.69%
jan 1, 1981
16.155
+1.103
7.33%
jan 1, 1982
15.576
-0.579
-3.58%
jan 1, 1983
13.966
-1.61
-10.34%
jan 1, 1984
12.68
-1.286
-9.21%
jan 1, 1985
12.889
+0.209
1.65%
jan 1, 1986
12.867
-0.022
-0.17%
jan 1, 1987
13.236
+0.368
2.86%
jan 1, 1988
13.657
+0.421
3.18%
jan 1, 1989
14.895
+1.238
9.07%
jan 1, 1990
14.796
-0.099
-0.67%
jan 1, 1991
15.414
+0.618
4.18%
jan 1, 1992
16.155
+0.741
4.81%
jan 1, 1993
16.946
+0.791
4.9%
jan 1, 1994
15.993
-0.953
-5.62%
jan 1, 1995
16.488
+0.495
3.09%
jan 1, 1996
17.482
+0.995
6.03%
jan 1, 1997
18.041
+0.559
3.2%
jan 1, 1998
18.755
+0.713
3.95%
jan 1, 1999
19.156
+0.402
2.14%
jan 1, 2000
19.064
-0.092
-0.48%
jan 1, 2001
19.83
+0.766
4.02%
jan 1, 2002
20.322
+0.491
2.48%
jan 1, 2003
19.956
-0.365
-1.8%
jan 1, 2004
20.415
+0.459
2.3%
jan 1, 2005
21.289
+0.874
4.28%
jan 1, 2006
21.094
-0.196
-0.92%
jan 1, 2007
21.498
+0.405
1.92%
jan 1, 2008
22.12
+0.622
2.89%
jan 1, 2009
23.459
+1.339
6.05%
jan 1, 2010
20.147
-3.312
-14.12%
jan 1, 2011
21.17
+1.023
5.08%
jan 1, 2012
22.478
+1.308
6.18%
jan 1, 2013
23.0
+0.522
2.32%
jan 1, 2014
23.295
+0.295
1.28%
jan 1, 2015
23.047
-0.247
-1.06%
jan 1, 2016
22.894
-0.154
-0.67%
Ranking of countries by current statistics by years


Comments: