29
/
en
AIzaSyAYiBZKx7MnpbEhh9jyipgxe19OcubqV5w
April 1, 2024
171815
Kuwait
KWT
true
2
1
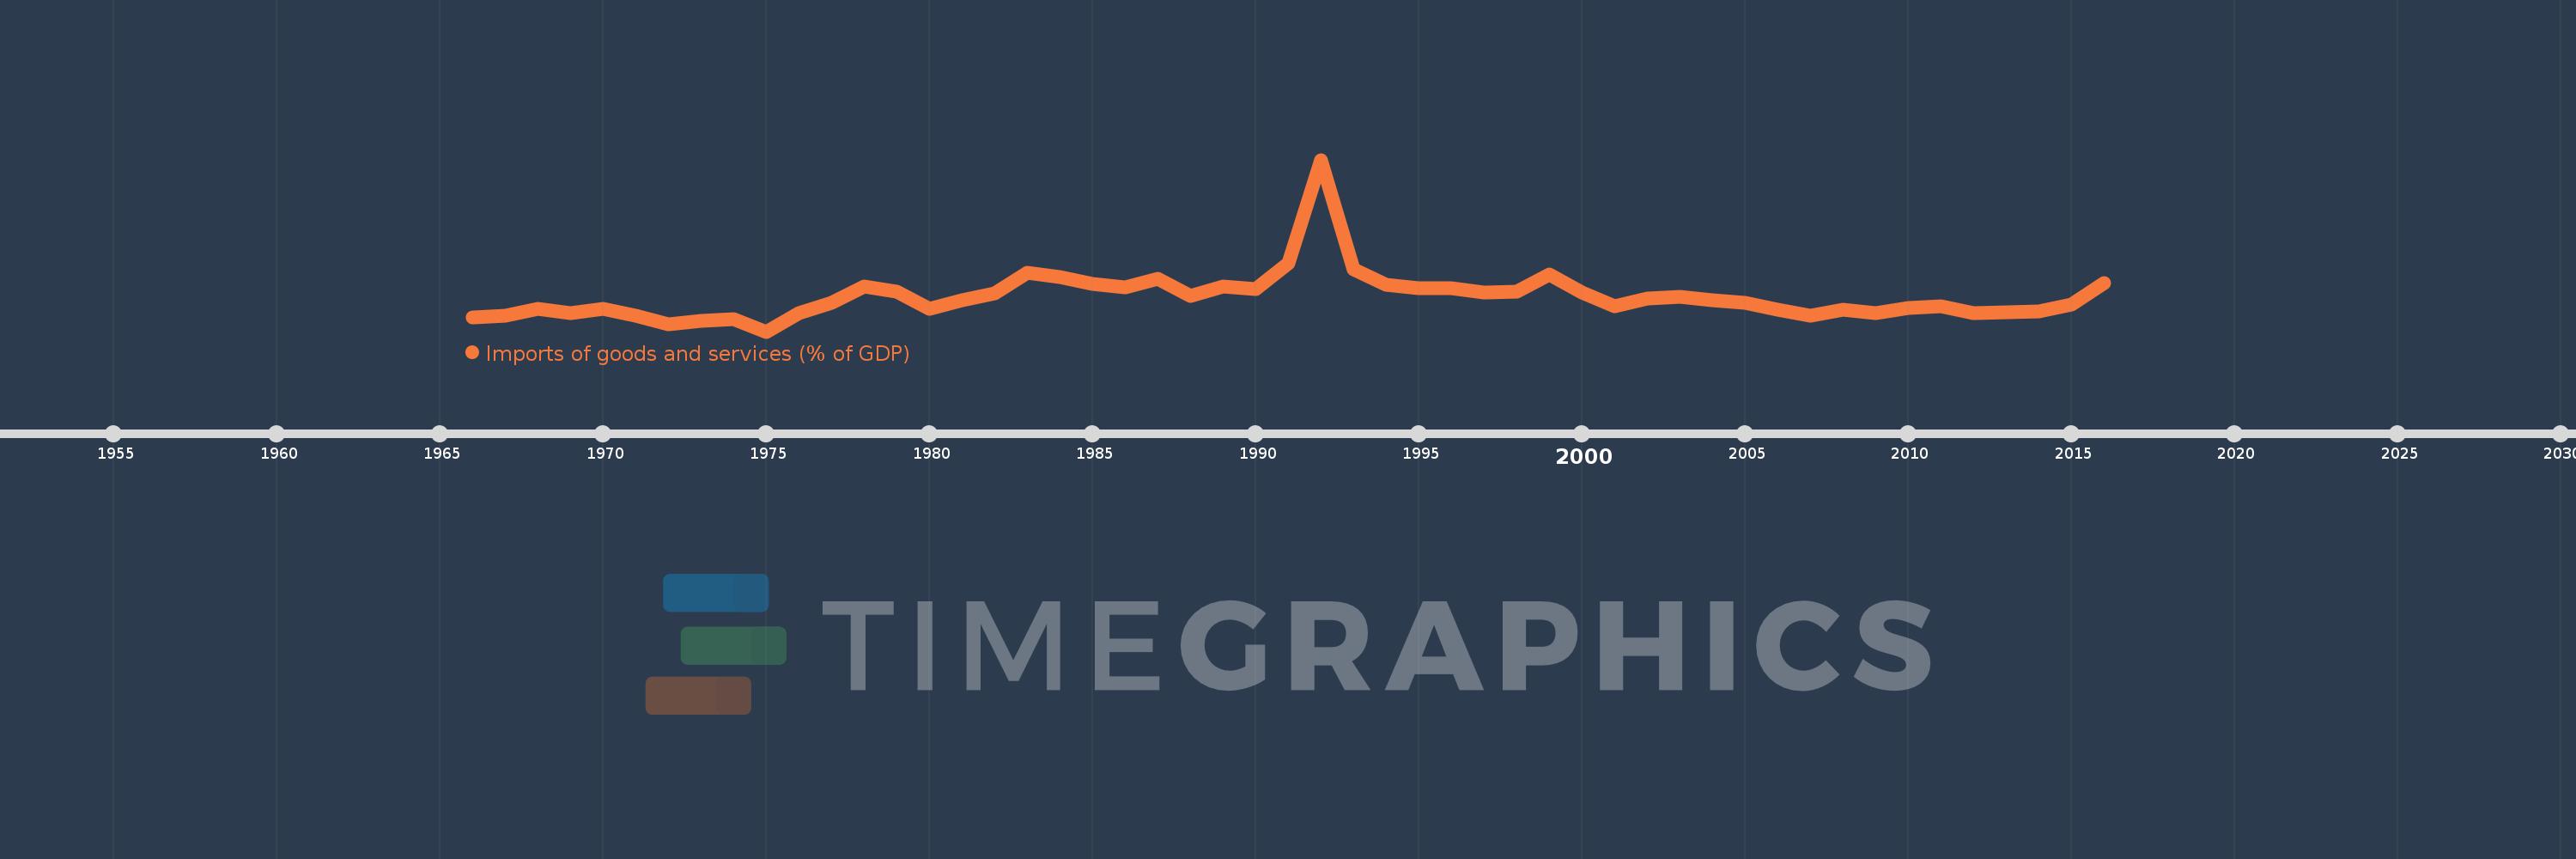
Imports of goods and services (% of GDP)
2016,2015,2014,2013,2012,2011,2010,2009,2008,2007,2006,2005,2004,2003,2002,2001,2000,1999,1998,1997,1996,1995,1994,1993,1992,1991,1990,1989,1988,1987,1986,1985,1984,1983,1982,1981,1980,1979,1978,1977,1976,1975,1974,1973,1972,1971,1970,1969,1968,1967,1966
This statistics in other country:
AfghanistanAlbaniaAlgeriaAngolaAntigua and BarbudaArab WorldArgentinaArmeniaArubaAustraliaAustriaAzerbaijanBahamas, TheBahrainBangladeshBarbadosBelarusBelgiumBelizeBeninBermudaBhutanBoliviaBosnia and HerzegovinaBotswanaBrazilBrunei DarussalamBulgariaBurkina FasoBurundiCabo VerdeCambodiaCameroonCanadaCaribbean small statesCentral African RepublicCentral Europe and the BalticsChadChileChinaColombiaComorosCongo, Dem. Rep.Congo, Rep.Costa RicaCote d'IvoireCroatiaCubaCyprusCzech RepublicDenmarkDjiboutiDominicaDominican RepublicEarly-demographic dividendEast Asia & PacificEast Asia & Pacific (excluding high income)East Asia & Pacific (IDA & IBRD countries)EcuadorEgypt, Arab Rep.El SalvadorEquatorial GuineaEritreaEstoniaEthiopiaEuro areaEurope & Central AsiaEurope & Central Asia (excluding high income)Europe & Central Asia (IDA & IBRD countries)European UnionFaroe IslandsFijiFinlandFragile and conflict affected situationsFranceFrench PolynesiaGabonGambia, TheGeorgiaGermanyGhanaGreeceGrenadaGuatemalaGuineaGuinea-BissauGuyanaHaitiHeavily indebted poor countries (HIPC)High incomeHondurasHong Kong SAR, ChinaHungaryIBRD onlyIcelandIDA & IBRD totalIDA blendIDA onlyIDA totalIndiaIndonesiaIran, Islamic Rep.IraqIrelandIsraelItalyJamaicaJapanJordanKazakhstanKenyaKiribatiKorea, Rep.KosovoKuwaitKyrgyz RepublicLao PDRLate-demographic dividendLatin America & Caribbean Latin America & Caribbean (excluding high income)Latin America & the Caribbean (IDA & IBRD countries)LatviaLeast developed countries: UN classificationLebanonLesothoLiberiaLibyaLithuaniaLow & middle incomeLow incomeLower middle incomeLuxembourgMacao SAR, ChinaMacedonia, FYRMadagascarMalawiMalaysiaMaldivesMaliMaltaMauritaniaMauritiusMexicoMicronesia, Fed. Sts.Middle East & North AfricaMiddle East & North Africa (excluding high income)Middle East & North Africa (IDA & IBRD countries)Middle incomeMoldovaMongoliaMontenegroMoroccoMozambiqueMyanmarNamibiaNepalNetherlandsNew CaledoniaNew ZealandNicaraguaNigerNigeriaNorth AmericaNorwayOECD membersOmanOther small statesPacific island small statesPakistanPalauPanamaPapua New GuineaParaguayPeruPhilippinesPolandPortugalPost-demographic dividendPre-demographic dividendPuerto RicoQatarRomaniaRussian FederationRwandaSamoaSaudi ArabiaSenegalSerbiaSeychellesSierra LeoneSingaporeSlovak RepublicSloveniaSmall statesSolomon IslandsSomaliaSouth AfricaSouth AsiaSouth Asia (IDA & IBRD)South SudanSpainSri LankaSt. Kitts and NevisSt. LuciaSt. Vincent and the GrenadinesSub-Saharan Africa Sub-Saharan Africa (excluding high income)Sub-Saharan Africa (IDA & IBRD countries)SudanSurinameSwazilandSwedenSwitzerlandSyrian Arab RepublicTajikistanTanzaniaThailandTimor-LesteTogoTongaTrinidad and TobagoTunisiaTurkeyTurkmenistanUgandaUkraineUnited Arab EmiratesUnited KingdomUnited StatesUpper middle incomeUruguayUzbekistanVanuatuVenezuela, RBVietnamWest Bank and GazaWorldYemen, Rep.ZambiaZimbabwe Timeline:
This timeline shows a graph from 1966 to 2016 of Kuwait. No data until 1965. Number of actual observations by date: 51.
Source name:
World Development Indicators
Source organization:
World Bank national accounts data, and OECD National Accounts data files.
Categories, topics:
Economy & Growth, Trade
Last updated:
apr 23, 2017
Indicators value changes by year
Minimum:
13.842
jan 1, 1975
Maximum:
125.711
jan 1, 1992
At the date of observation
Value
Absolute change
Change from previous value
jan 1, 1966
23.097
+23.097
0.0%
jan 1, 1967
24.356
+1.259
5.45%
jan 1, 1968
28.44
+4.084
16.77%
jan 1, 1969
26.078
-2.363
-8.31%
jan 1, 1970
28.918
+2.84
10.89%
jan 1, 1971
24.116
-4.802
-16.61%
jan 1, 1972
18.664
-5.452
-22.61%
jan 1, 1973
20.663
+1.999
10.71%
jan 1, 1974
22.168
+1.506
7.29%
jan 1, 1975
13.842
-8.326
-37.56%
jan 1, 1976
26.011
+12.169
87.91%
jan 1, 1977
32.555
+6.544
25.16%
jan 1, 1978
43.443
+10.888
33.45%
jan 1, 1979
39.866
-3.577
-8.23%
jan 1, 1980
28.817
-11.049
-27.72%
jan 1, 1981
34.298
+5.481
19.02%
jan 1, 1982
38.478
+4.18
12.19%
jan 1, 1983
52.364
+13.886
36.09%
jan 1, 1984
49.352
-3.012
-5.75%
jan 1, 1985
44.641
-4.711
-9.55%
jan 1, 1986
42.745
-1.897
-4.25%
jan 1, 1987
48.013
+5.268
12.32%
jan 1, 1988
37.123
-10.89
-22.68%
jan 1, 1989
42.94
+5.817
15.67%
jan 1, 1990
41.37
-1.57
-3.66%
jan 1, 1991
58.072
+16.702
40.37%
jan 1, 1992
125.711
+67.639
116.47%
jan 1, 1993
54.218
-71.493
-56.87%
jan 1, 1994
44.286
-9.932
-18.32%
jan 1, 1995
42.331
-1.955
-4.42%
jan 1, 1996
41.965
-0.366
-0.86%
jan 1, 1997
39.186
-2.778
-6.62%
jan 1, 1998
39.592
+0.405
1.03%
jan 1, 1999
51.093
+11.502
29.05%
jan 1, 2000
39.437
-11.657
-22.81%
jan 1, 2001
30.147
-9.29
-23.56%
jan 1, 2002
35.539
+5.392
17.89%
jan 1, 2003
36.609
+1.07
3.01%
jan 1, 2004
34.464
-2.145
-5.86%
jan 1, 2005
32.38
-2.084
-6.05%
jan 1, 2006
28.267
-4.113
-12.7%
jan 1, 2007
24.167
-4.1
-14.5%
jan 1, 2008
28.317
+4.15
17.17%
jan 1, 2009
25.924
-2.393
-8.45%
jan 1, 2010
29.395
+3.471
13.39%
jan 1, 2011
30.355
+0.96
3.26%
jan 1, 2012
25.899
-4.456
-14.68%
jan 1, 2013
26.28
+0.381
1.47%
jan 1, 2014
26.745
+0.466
1.77%
jan 1, 2015
31.531
+4.786
17.89%
jan 1, 2016
45.263
+13.732
43.55%
Ranking of countries by current statistics by years


Comments: