29
/
en
AIzaSyAYiBZKx7MnpbEhh9jyipgxe19OcubqV5w
April 1, 2024
64838
Albania
ALB
true
2
1
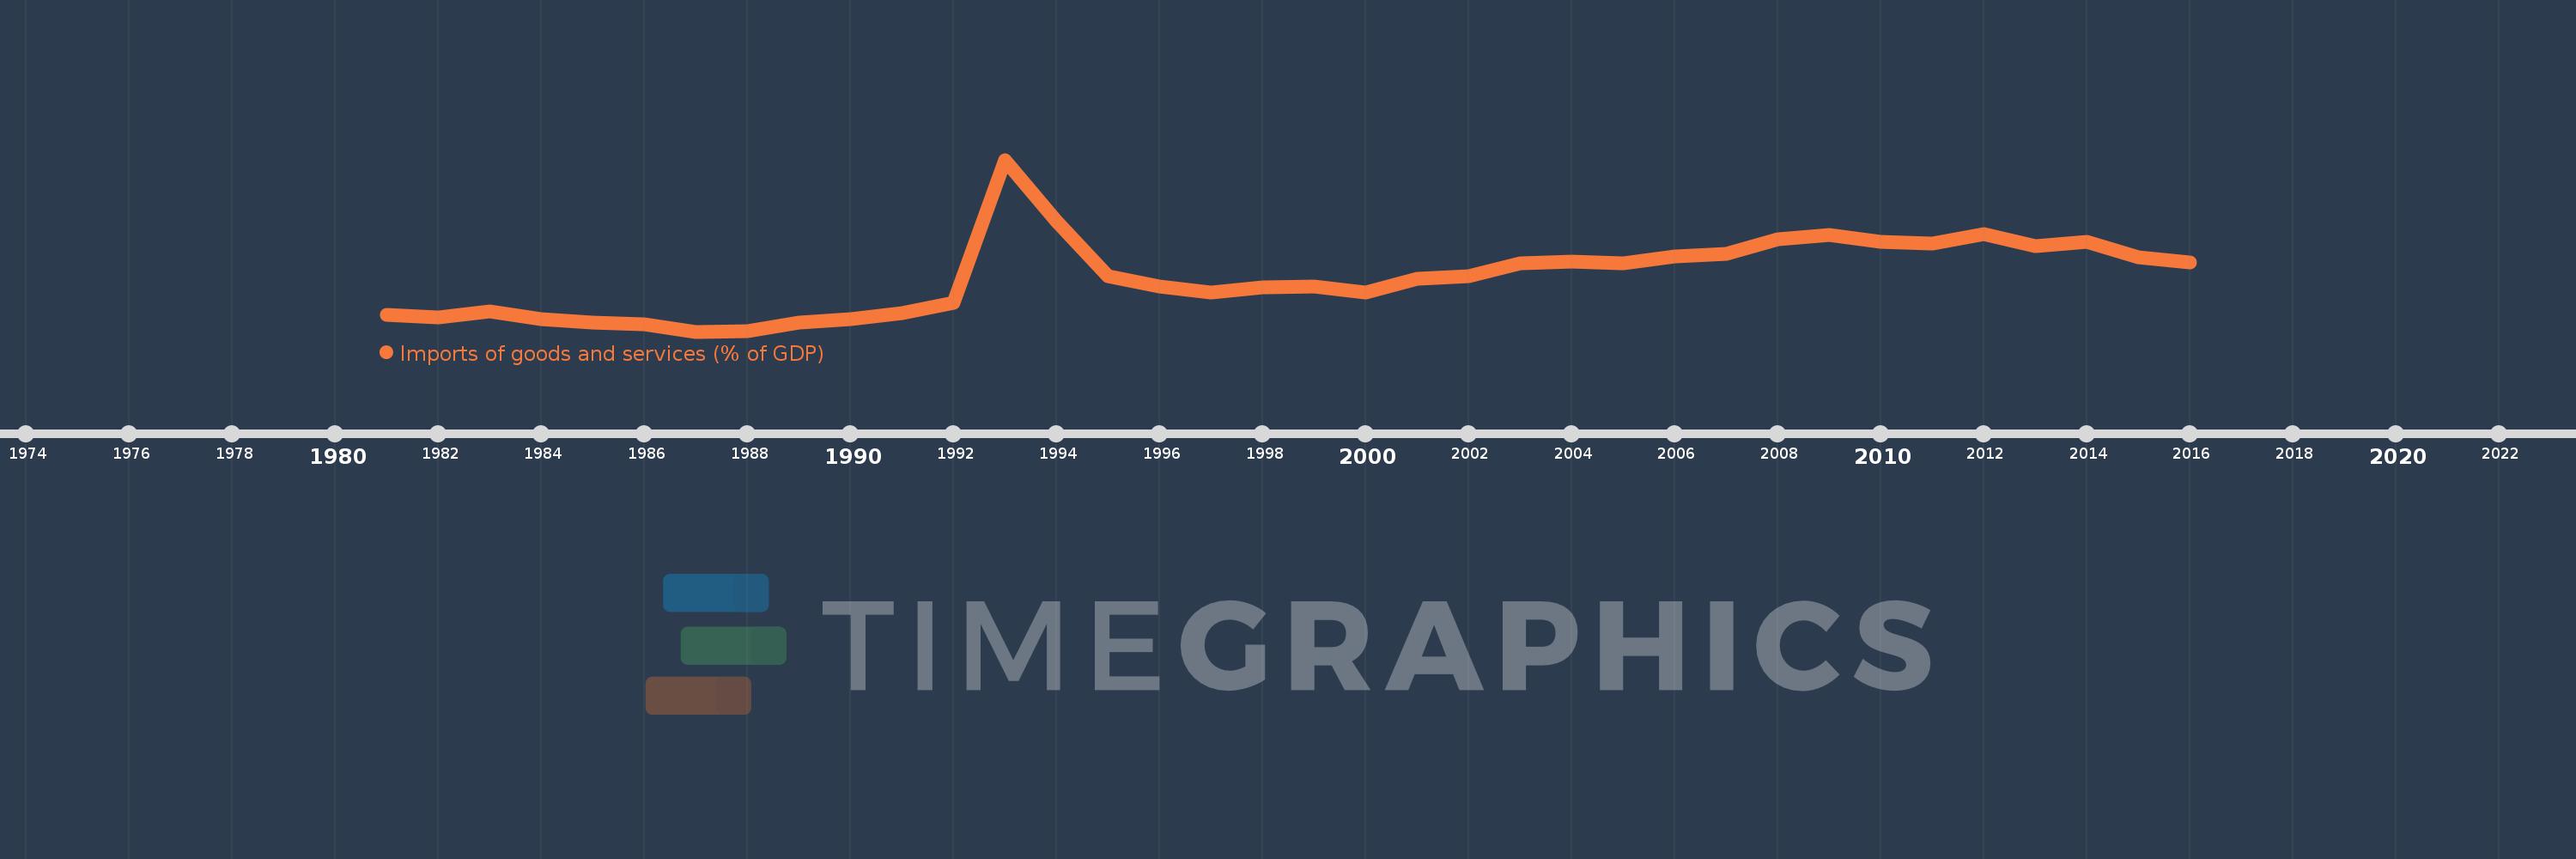
Imports of goods and services (% of GDP)
2016,2015,2014,2013,2012,2011,2010,2009,2008,2007,2006,2005,2004,2003,2002,2001,2000,1999,1998,1997,1996,1995,1994,1993,1992,1991,1990,1989,1988,1987,1986,1985,1984,1983,1982,1981
This statistics in other country:
AfghanistanAlbaniaAlgeriaAngolaAntigua and BarbudaArab WorldArgentinaArmeniaArubaAustraliaAustriaAzerbaijanBahamas, TheBahrainBangladeshBarbadosBelarusBelgiumBelizeBeninBermudaBhutanBoliviaBosnia and HerzegovinaBotswanaBrazilBrunei DarussalamBulgariaBurkina FasoBurundiCabo VerdeCambodiaCameroonCanadaCaribbean small statesCentral African RepublicCentral Europe and the BalticsChadChileChinaColombiaComorosCongo, Dem. Rep.Congo, Rep.Costa RicaCote d'IvoireCroatiaCubaCyprusCzech RepublicDenmarkDjiboutiDominicaDominican RepublicEarly-demographic dividendEast Asia & PacificEast Asia & Pacific (excluding high income)East Asia & Pacific (IDA & IBRD countries)EcuadorEgypt, Arab Rep.El SalvadorEquatorial GuineaEritreaEstoniaEthiopiaEuro areaEurope & Central AsiaEurope & Central Asia (excluding high income)Europe & Central Asia (IDA & IBRD countries)European UnionFaroe IslandsFijiFinlandFragile and conflict affected situationsFranceFrench PolynesiaGabonGambia, TheGeorgiaGermanyGhanaGreeceGrenadaGuatemalaGuineaGuinea-BissauGuyanaHaitiHeavily indebted poor countries (HIPC)High incomeHondurasHong Kong SAR, ChinaHungaryIBRD onlyIcelandIDA & IBRD totalIDA blendIDA onlyIDA totalIndiaIndonesiaIran, Islamic Rep.IraqIrelandIsraelItalyJamaicaJapanJordanKazakhstanKenyaKiribatiKorea, Rep.KosovoKuwaitKyrgyz RepublicLao PDRLate-demographic dividendLatin America & Caribbean Latin America & Caribbean (excluding high income)Latin America & the Caribbean (IDA & IBRD countries)LatviaLeast developed countries: UN classificationLebanonLesothoLiberiaLibyaLithuaniaLow & middle incomeLow incomeLower middle incomeLuxembourgMacao SAR, ChinaMacedonia, FYRMadagascarMalawiMalaysiaMaldivesMaliMaltaMauritaniaMauritiusMexicoMicronesia, Fed. Sts.Middle East & North AfricaMiddle East & North Africa (excluding high income)Middle East & North Africa (IDA & IBRD countries)Middle incomeMoldovaMongoliaMontenegroMoroccoMozambiqueMyanmarNamibiaNepalNetherlandsNew CaledoniaNew ZealandNicaraguaNigerNigeriaNorth AmericaNorwayOECD membersOmanOther small statesPacific island small statesPakistanPalauPanamaPapua New GuineaParaguayPeruPhilippinesPolandPortugalPost-demographic dividendPre-demographic dividendPuerto RicoQatarRomaniaRussian FederationRwandaSamoaSaudi ArabiaSenegalSerbiaSeychellesSierra LeoneSingaporeSlovak RepublicSloveniaSmall statesSolomon IslandsSomaliaSouth AfricaSouth AsiaSouth Asia (IDA & IBRD)South SudanSpainSri LankaSt. Kitts and NevisSt. LuciaSt. Vincent and the GrenadinesSub-Saharan Africa Sub-Saharan Africa (excluding high income)Sub-Saharan Africa (IDA & IBRD countries)SudanSurinameSwazilandSwedenSwitzerlandSyrian Arab RepublicTajikistanTanzaniaThailandTimor-LesteTogoTongaTrinidad and TobagoTunisiaTurkeyTurkmenistanUgandaUkraineUnited Arab EmiratesUnited KingdomUnited StatesUpper middle incomeUruguayUzbekistanVanuatuVenezuela, RBVietnamWest Bank and GazaWorldYemen, Rep.ZambiaZimbabwe Timeline:
This timeline shows a graph from 1981 to 2016 of Albania. No data until 1980. Number of actual observations by date: 36.
Source name:
World Development Indicators
Source organization:
World Bank national accounts data, and OECD National Accounts data files.
Categories, topics:
Economy & Growth, Trade
Last updated:
apr 23, 2017
Indicators value changes by year
Minimum:
15.468
jan 1, 1987
Maximum:
88.512
jan 1, 1993
At the date of observation
Value
Absolute change
Change from previous value
jan 1, 1981
22.709
+22.709
0.0%
jan 1, 1982
21.515
-1.195
-5.26%
jan 1, 1983
23.878
+2.363
10.98%
jan 1, 1984
20.809
-3.069
-12.85%
jan 1, 1985
19.377
-1.432
-6.88%
jan 1, 1986
18.45
-0.927
-4.79%
jan 1, 1987
15.468
-2.982
-16.16%
jan 1, 1988
15.563
+0.095
0.61%
jan 1, 1989
19.218
+3.656
23.49%
jan 1, 1990
20.718
+1.5
7.81%
jan 1, 1991
23.196
+2.478
11.96%
jan 1, 1992
27.592
+4.395
18.95%
jan 1, 1993
88.512
+60.92
220.79%
jan 1, 1994
62.293
-26.22
-29.62%
jan 1, 1995
38.95
-23.342
-37.47%
jan 1, 1996
34.512
-4.438
-11.39%
jan 1, 1997
32.024
-2.488
-7.21%
jan 1, 1998
34.19
+2.166
6.76%
jan 1, 1999
34.637
+0.447
1.31%
jan 1, 2000
32.213
-2.424
-7.0%
jan 1, 2001
38.053
+5.84
18.13%
jan 1, 2002
38.999
+0.945
2.48%
jan 1, 2003
44.335
+5.337
13.68%
jan 1, 2004
45.085
+0.749
1.69%
jan 1, 2005
44.375
-0.71
-1.57%
jan 1, 2006
47.471
+3.096
6.98%
jan 1, 2007
48.521
+1.05
2.21%
jan 1, 2008
54.788
+6.267
12.92%
jan 1, 2009
56.437
+1.649
3.01%
jan 1, 2010
53.759
-2.678
-4.75%
jan 1, 2011
53.025
-0.734
-1.37%
jan 1, 2012
56.749
+3.725
7.02%
jan 1, 2013
51.987
-4.762
-8.39%
jan 1, 2014
53.481
+1.494
2.87%
jan 1, 2015
47.225
-6.256
-11.7%
jan 1, 2016
44.904
-2.321
-4.91%
Ranking of countries by current statistics by years


Comments: