29
/
en
AIzaSyAYiBZKx7MnpbEhh9jyipgxe19OcubqV5w
April 1, 2024
199268
Mongolia
MNG
true
2
1
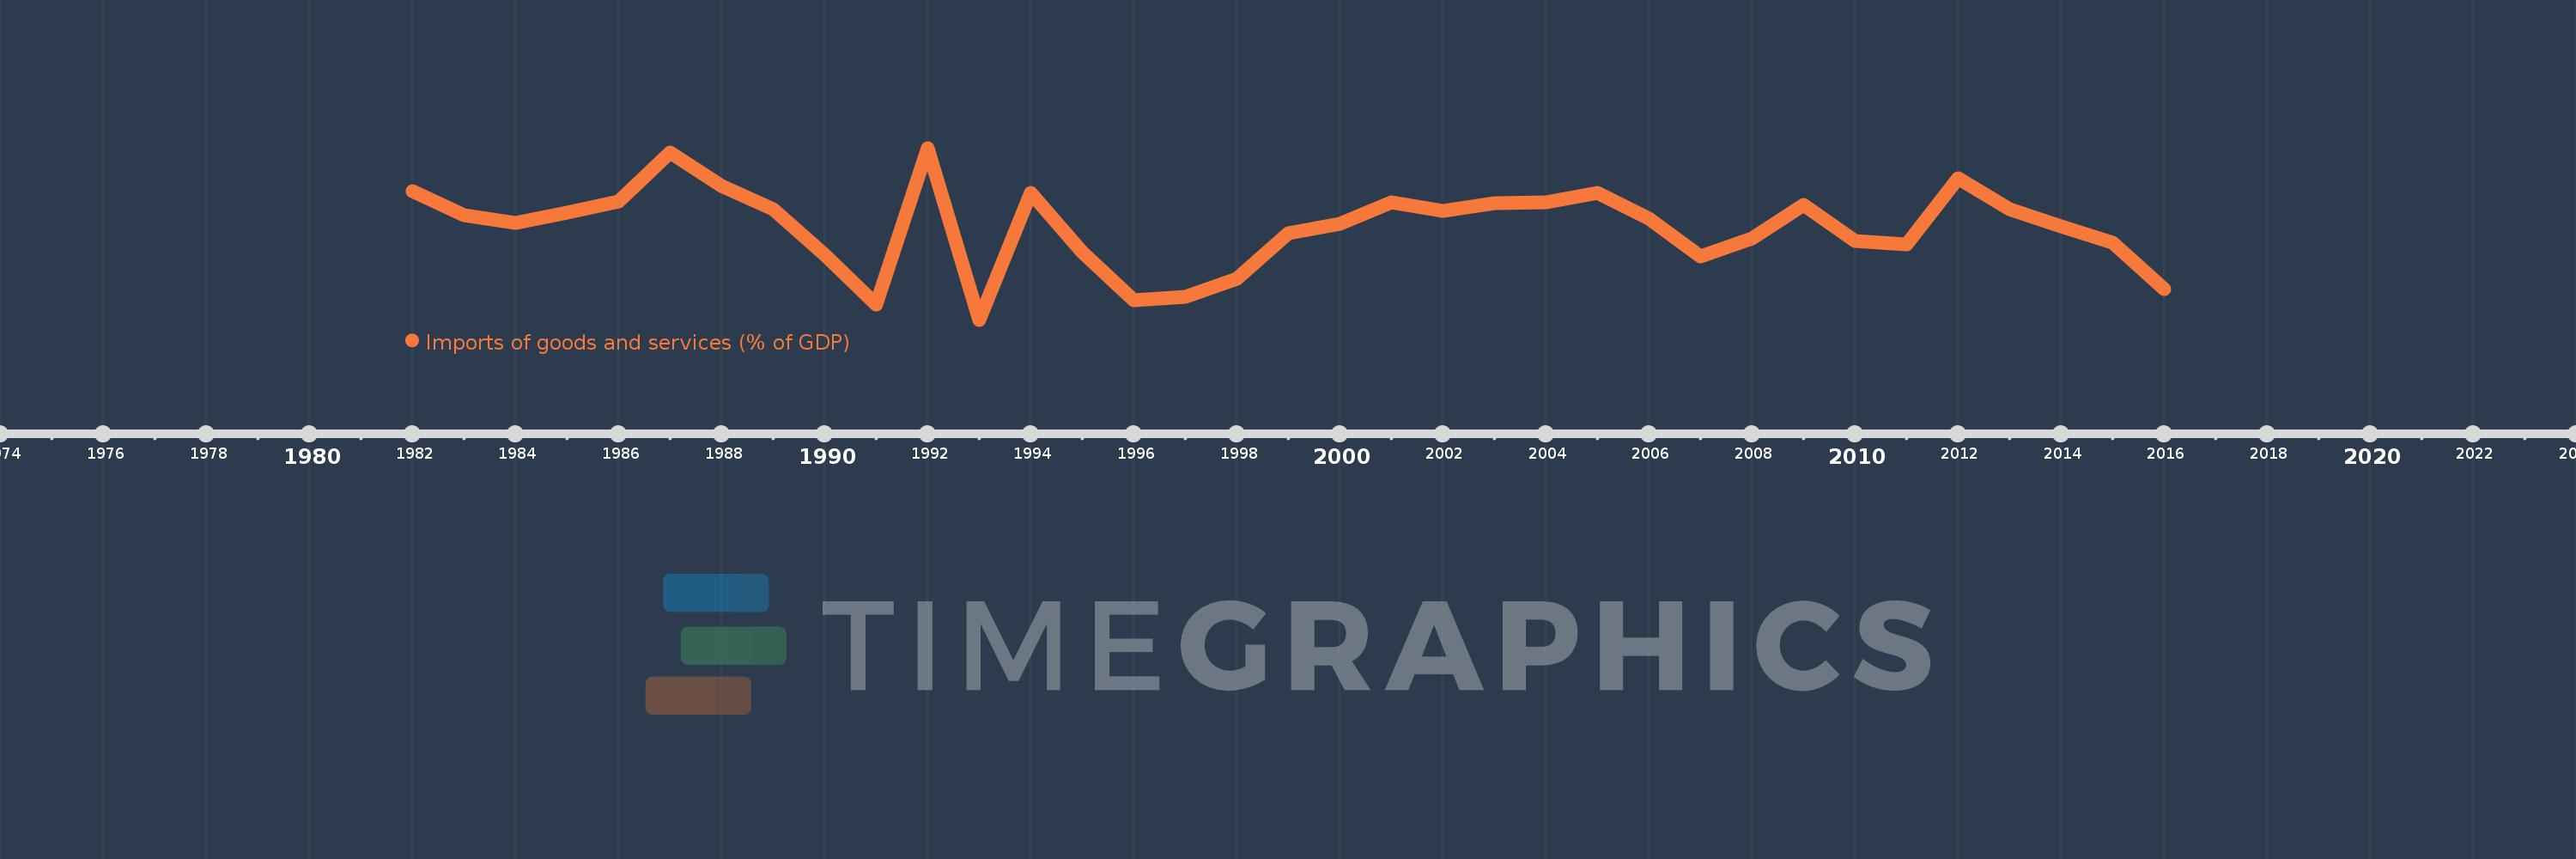
Imports of goods and services (% of GDP)
2016,2015,2014,2013,2012,2011,2010,2009,2008,2007,2006,2005,2004,2003,2002,2001,2000,1999,1998,1997,1996,1995,1994,1993,1992,1991,1990,1989,1988,1987,1986,1985,1984,1983,1982
This statistics in other country:
AfghanistanAlbaniaAlgeriaAngolaAntigua and BarbudaArab WorldArgentinaArmeniaArubaAustraliaAustriaAzerbaijanBahamas, TheBahrainBangladeshBarbadosBelarusBelgiumBelizeBeninBermudaBhutanBoliviaBosnia and HerzegovinaBotswanaBrazilBrunei DarussalamBulgariaBurkina FasoBurundiCabo VerdeCambodiaCameroonCanadaCaribbean small statesCentral African RepublicCentral Europe and the BalticsChadChileChinaColombiaComorosCongo, Dem. Rep.Congo, Rep.Costa RicaCote d'IvoireCroatiaCubaCyprusCzech RepublicDenmarkDjiboutiDominicaDominican RepublicEarly-demographic dividendEast Asia & PacificEast Asia & Pacific (excluding high income)East Asia & Pacific (IDA & IBRD countries)EcuadorEgypt, Arab Rep.El SalvadorEquatorial GuineaEritreaEstoniaEthiopiaEuro areaEurope & Central AsiaEurope & Central Asia (excluding high income)Europe & Central Asia (IDA & IBRD countries)European UnionFaroe IslandsFijiFinlandFragile and conflict affected situationsFranceFrench PolynesiaGabonGambia, TheGeorgiaGermanyGhanaGreeceGrenadaGuatemalaGuineaGuinea-BissauGuyanaHaitiHeavily indebted poor countries (HIPC)High incomeHondurasHong Kong SAR, ChinaHungaryIBRD onlyIcelandIDA & IBRD totalIDA blendIDA onlyIDA totalIndiaIndonesiaIran, Islamic Rep.IraqIrelandIsraelItalyJamaicaJapanJordanKazakhstanKenyaKiribatiKorea, Rep.KosovoKuwaitKyrgyz RepublicLao PDRLate-demographic dividendLatin America & Caribbean Latin America & Caribbean (excluding high income)Latin America & the Caribbean (IDA & IBRD countries)LatviaLeast developed countries: UN classificationLebanonLesothoLiberiaLibyaLithuaniaLow & middle incomeLow incomeLower middle incomeLuxembourgMacao SAR, ChinaMacedonia, FYRMadagascarMalawiMalaysiaMaldivesMaliMaltaMauritaniaMauritiusMexicoMicronesia, Fed. Sts.Middle East & North AfricaMiddle East & North Africa (excluding high income)Middle East & North Africa (IDA & IBRD countries)Middle incomeMoldovaMongoliaMontenegroMoroccoMozambiqueMyanmarNamibiaNepalNetherlandsNew CaledoniaNew ZealandNicaraguaNigerNigeriaNorth AmericaNorwayOECD membersOmanOther small statesPacific island small statesPakistanPalauPanamaPapua New GuineaParaguayPeruPhilippinesPolandPortugalPost-demographic dividendPre-demographic dividendPuerto RicoQatarRomaniaRussian FederationRwandaSamoaSaudi ArabiaSenegalSerbiaSeychellesSierra LeoneSingaporeSlovak RepublicSloveniaSmall statesSolomon IslandsSomaliaSouth AfricaSouth AsiaSouth Asia (IDA & IBRD)South SudanSpainSri LankaSt. Kitts and NevisSt. LuciaSt. Vincent and the GrenadinesSub-Saharan Africa Sub-Saharan Africa (excluding high income)Sub-Saharan Africa (IDA & IBRD countries)SudanSurinameSwazilandSwedenSwitzerlandSyrian Arab RepublicTajikistanTanzaniaThailandTimor-LesteTogoTongaTrinidad and TobagoTunisiaTurkeyTurkmenistanUgandaUkraineUnited Arab EmiratesUnited KingdomUnited StatesUpper middle incomeUruguayUzbekistanVanuatuVenezuela, RBVietnamWest Bank and GazaWorldYemen, Rep.ZambiaZimbabwe Timeline:
This timeline shows a graph from 1982 to 2016 of Mongolia. No data until 1981. Number of actual observations by date: 35.
Source name:
World Development Indicators
Source organization:
World Bank national accounts data, and OECD National Accounts data files.
Categories, topics:
Economy & Growth, Trade
Last updated:
apr 23, 2017
Indicators value changes by year
Minimum:
36.363
jan 1, 1993
Maximum:
82.535
jan 1, 1992
At the date of observation
Value
Absolute change
Change from previous value
jan 1, 1982
71.034
+71.034
0.0%
jan 1, 1983
64.458
-6.576
-9.26%
jan 1, 1984
62.422
-2.036
-3.16%
jan 1, 1985
65.072
+2.65
4.25%
jan 1, 1986
68.207
+3.135
4.82%
jan 1, 1987
81.393
+13.187
19.33%
jan 1, 1988
72.262
-9.131
-11.22%
jan 1, 1989
66.023
-6.24
-8.63%
jan 1, 1990
53.877
-12.145
-18.4%
jan 1, 1991
40.347
-13.53
-25.11%
jan 1, 1992
82.535
+42.188
104.56%
jan 1, 1993
36.363
-46.173
-55.94%
jan 1, 1994
70.41
+34.047
93.63%
jan 1, 1995
54.527
-15.883
-22.56%
jan 1, 1996
41.562
-12.964
-23.78%
jan 1, 1997
42.45
+0.887
2.14%
jan 1, 1998
47.325
+4.875
11.49%
jan 1, 1999
59.508
+12.183
25.74%
jan 1, 2000
62.083
+2.575
4.33%
jan 1, 2001
67.89
+5.807
9.35%
jan 1, 2002
65.5
-2.39
-3.52%
jan 1, 2003
67.791
+2.291
3.5%
jan 1, 2004
67.947
+0.157
0.23%
jan 1, 2005
70.542
+2.594
3.82%
jan 1, 2006
63.612
-6.929
-9.82%
jan 1, 2007
53.487
-10.125
-15.92%
jan 1, 2008
58.266
+4.779
8.94%
jan 1, 2009
67.181
+8.915
15.3%
jan 1, 2010
57.536
-9.645
-14.36%
jan 1, 2011
56.671
-0.865
-1.5%
jan 1, 2012
74.446
+17.775
31.36%
jan 1, 2013
66.016
-8.429
-11.32%
jan 1, 2014
61.422
-4.595
-6.96%
jan 1, 2015
57.073
-4.348
-7.08%
jan 1, 2016
44.673
-12.4
-21.73%
Ranking of countries by current statistics by years


Comments: