29
/
en
AIzaSyAYiBZKx7MnpbEhh9jyipgxe19OcubqV5w
April 1, 2024
112372
Costa Rica
CRI
true
2
1
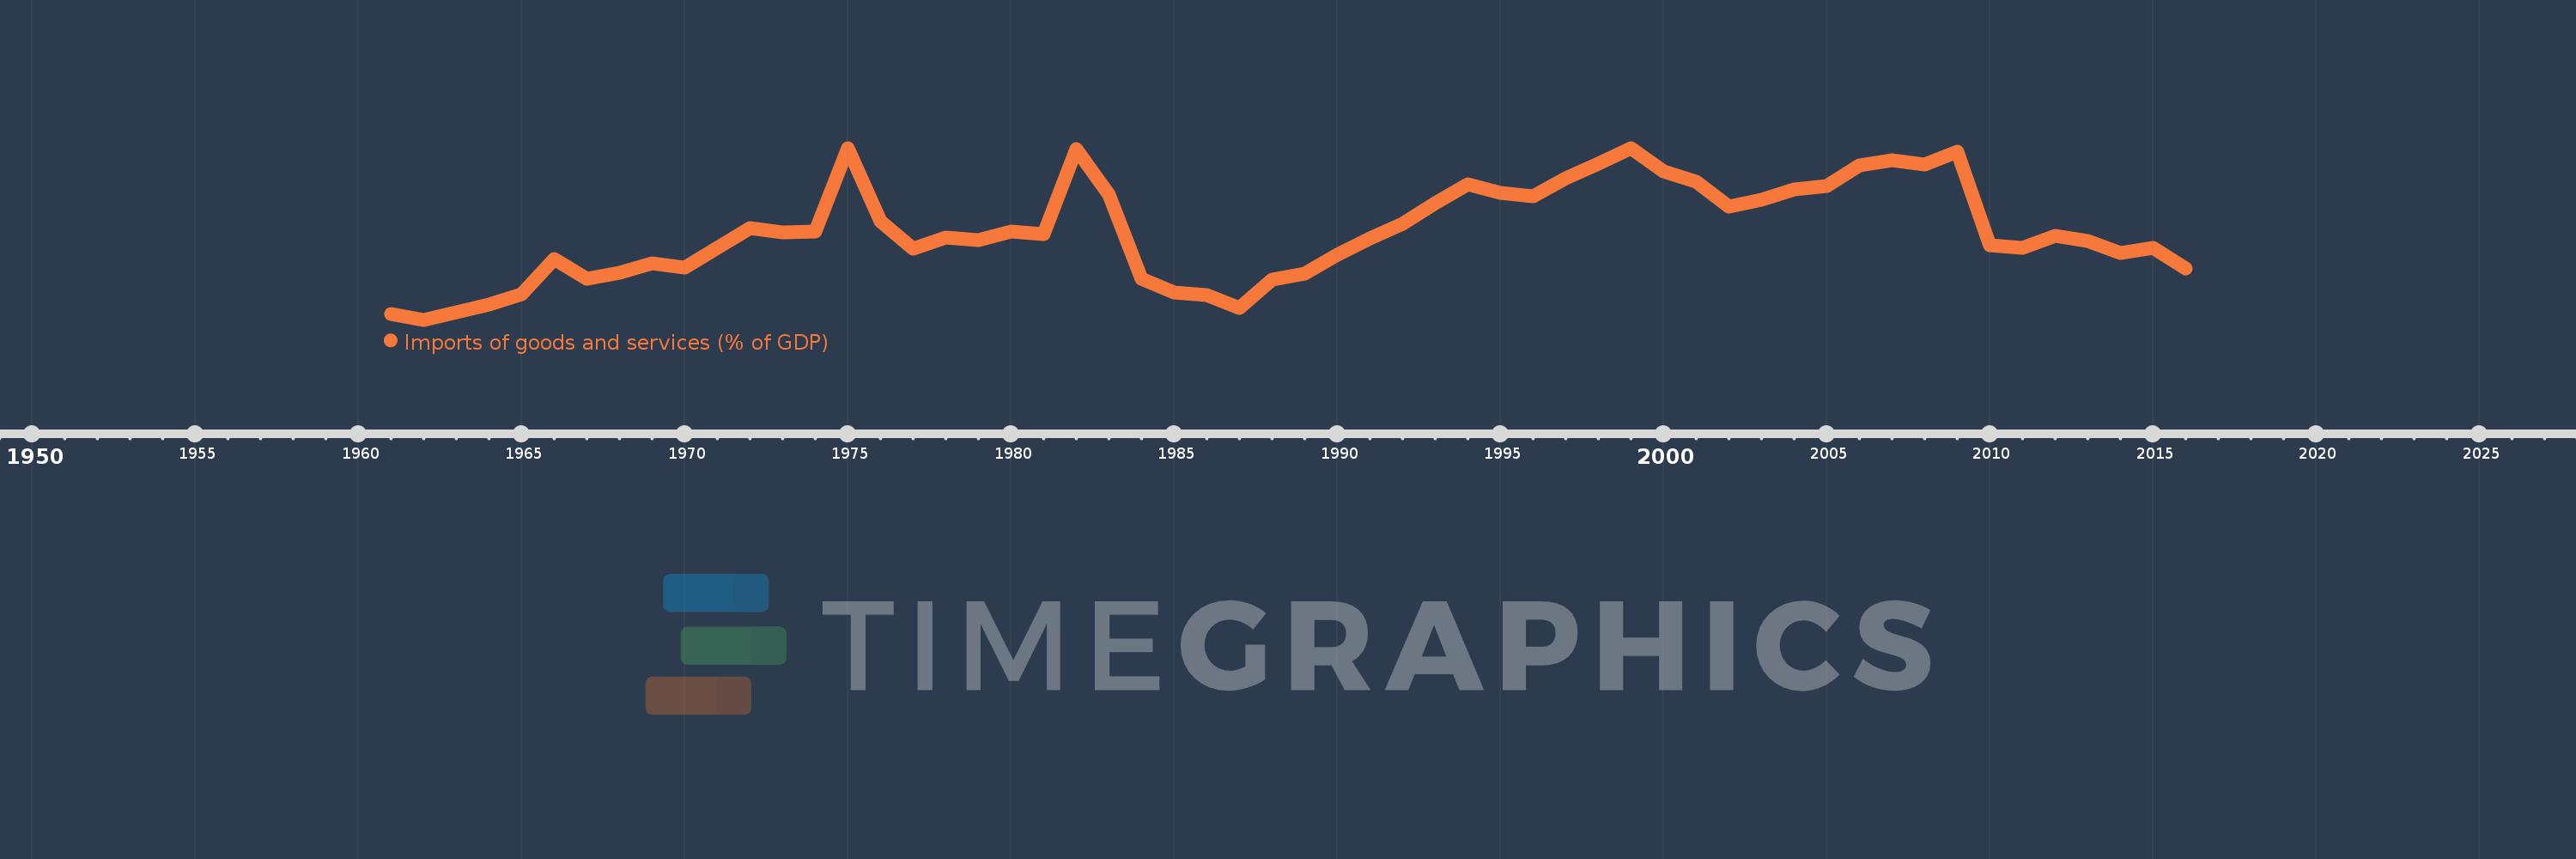
Imports of goods and services (% of GDP)
2016,2015,2014,2013,2012,2011,2010,2009,2008,2007,2006,2005,2004,2003,2002,2001,2000,1999,1998,1997,1996,1995,1994,1993,1992,1991,1990,1989,1988,1987,1986,1985,1984,1983,1982,1981,1980,1979,1978,1977,1976,1975,1974,1973,1972,1971,1970,1969,1968,1967,1966,1965,1964,1963,1962,1961
This statistics in other country:
AfghanistanAlbaniaAlgeriaAngolaAntigua and BarbudaArab WorldArgentinaArmeniaArubaAustraliaAustriaAzerbaijanBahamas, TheBahrainBangladeshBarbadosBelarusBelgiumBelizeBeninBermudaBhutanBoliviaBosnia and HerzegovinaBotswanaBrazilBrunei DarussalamBulgariaBurkina FasoBurundiCabo VerdeCambodiaCameroonCanadaCaribbean small statesCentral African RepublicCentral Europe and the BalticsChadChileChinaColombiaComorosCongo, Dem. Rep.Congo, Rep.Costa RicaCote d'IvoireCroatiaCubaCyprusCzech RepublicDenmarkDjiboutiDominicaDominican RepublicEarly-demographic dividendEast Asia & PacificEast Asia & Pacific (excluding high income)East Asia & Pacific (IDA & IBRD countries)EcuadorEgypt, Arab Rep.El SalvadorEquatorial GuineaEritreaEstoniaEthiopiaEuro areaEurope & Central AsiaEurope & Central Asia (excluding high income)Europe & Central Asia (IDA & IBRD countries)European UnionFaroe IslandsFijiFinlandFragile and conflict affected situationsFranceFrench PolynesiaGabonGambia, TheGeorgiaGermanyGhanaGreeceGrenadaGuatemalaGuineaGuinea-BissauGuyanaHaitiHeavily indebted poor countries (HIPC)High incomeHondurasHong Kong SAR, ChinaHungaryIBRD onlyIcelandIDA & IBRD totalIDA blendIDA onlyIDA totalIndiaIndonesiaIran, Islamic Rep.IraqIrelandIsraelItalyJamaicaJapanJordanKazakhstanKenyaKiribatiKorea, Rep.KosovoKuwaitKyrgyz RepublicLao PDRLate-demographic dividendLatin America & Caribbean Latin America & Caribbean (excluding high income)Latin America & the Caribbean (IDA & IBRD countries)LatviaLeast developed countries: UN classificationLebanonLesothoLiberiaLibyaLithuaniaLow & middle incomeLow incomeLower middle incomeLuxembourgMacao SAR, ChinaMacedonia, FYRMadagascarMalawiMalaysiaMaldivesMaliMaltaMauritaniaMauritiusMexicoMicronesia, Fed. Sts.Middle East & North AfricaMiddle East & North Africa (excluding high income)Middle East & North Africa (IDA & IBRD countries)Middle incomeMoldovaMongoliaMontenegroMoroccoMozambiqueMyanmarNamibiaNepalNetherlandsNew CaledoniaNew ZealandNicaraguaNigerNigeriaNorth AmericaNorwayOECD membersOmanOther small statesPacific island small statesPakistanPalauPanamaPapua New GuineaParaguayPeruPhilippinesPolandPortugalPost-demographic dividendPre-demographic dividendPuerto RicoQatarRomaniaRussian FederationRwandaSamoaSaudi ArabiaSenegalSerbiaSeychellesSierra LeoneSingaporeSlovak RepublicSloveniaSmall statesSolomon IslandsSomaliaSouth AfricaSouth AsiaSouth Asia (IDA & IBRD)South SudanSpainSri LankaSt. Kitts and NevisSt. LuciaSt. Vincent and the GrenadinesSub-Saharan Africa Sub-Saharan Africa (excluding high income)Sub-Saharan Africa (IDA & IBRD countries)SudanSurinameSwazilandSwedenSwitzerlandSyrian Arab RepublicTajikistanTanzaniaThailandTimor-LesteTogoTongaTrinidad and TobagoTunisiaTurkeyTurkmenistanUgandaUkraineUnited Arab EmiratesUnited KingdomUnited StatesUpper middle incomeUruguayUzbekistanVanuatuVenezuela, RBVietnamWest Bank and GazaWorldYemen, Rep.ZambiaZimbabwe Timeline:
This timeline shows a graph from 1961 to 2016 of Costa Rica. No data until 1960. Number of actual observations by date: 56.
Source name:
World Development Indicators
Source organization:
World Bank national accounts data, and OECD National Accounts data files.
Categories, topics:
Economy & Growth, Trade
Last updated:
apr 23, 2017
Indicators value changes by year
Minimum:
25.399
jan 1, 1962
Maximum:
48.341
jan 1, 1975
At the date of observation
Value
Absolute change
Change from previous value
jan 1, 1961
26.177
+26.177
0.0%
jan 1, 1962
25.399
-0.779
-2.97%
jan 1, 1963
26.345
+0.946
3.73%
jan 1, 1964
27.434
+1.089
4.13%
jan 1, 1965
28.754
+1.32
4.81%
jan 1, 1966
33.484
+4.73
16.45%
jan 1, 1967
30.844
-2.64
-7.88%
jan 1, 1968
31.628
+0.784
2.54%
jan 1, 1969
32.91
+1.282
4.05%
jan 1, 1970
32.334
-0.576
-1.75%
jan 1, 1971
34.99
+2.655
8.21%
jan 1, 1972
37.64
+2.651
7.58%
jan 1, 1973
37.105
-0.535
-1.42%
jan 1, 1974
37.222
+0.116
0.31%
jan 1, 1975
48.341
+11.119
29.87%
jan 1, 1976
38.548
-9.793
-20.26%
jan 1, 1977
34.911
-3.637
-9.44%
jan 1, 1978
36.335
+1.424
4.08%
jan 1, 1979
36.031
-0.303
-0.83%
jan 1, 1980
37.193
+1.162
3.22%
jan 1, 1981
36.819
-0.374
-1.01%
jan 1, 1982
48.176
+11.357
30.85%
jan 1, 1983
42.165
-6.011
-12.48%
jan 1, 1984
30.857
-11.308
-26.82%
jan 1, 1985
29.031
-1.826
-5.92%
jan 1, 1986
28.72
-0.31
-1.07%
jan 1, 1987
26.954
-1.766
-6.15%
jan 1, 1988
30.733
+3.779
14.02%
jan 1, 1989
31.573
+0.84
2.73%
jan 1, 1990
34.091
+2.517
7.97%
jan 1, 1991
36.282
+2.191
6.43%
jan 1, 1992
38.178
+1.897
5.23%
jan 1, 1993
40.984
+2.806
7.35%
jan 1, 1994
43.522
+2.538
6.19%
jan 1, 1995
42.331
-1.191
-2.74%
jan 1, 1996
41.881
-0.451
-1.06%
jan 1, 1997
44.273
+2.392
5.71%
jan 1, 1998
46.233
+1.96
4.43%
jan 1, 1999
48.311
+2.078
4.49%
jan 1, 2000
45.168
-3.143
-6.51%
jan 1, 2001
43.782
-1.387
-3.07%
jan 1, 2002
40.503
-3.278
-7.49%
jan 1, 2003
41.374
+0.871
2.15%
jan 1, 2004
42.844
+1.47
3.55%
jan 1, 2005
43.238
+0.395
0.92%
jan 1, 2006
45.97
+2.732
6.32%
jan 1, 2007
46.733
+0.763
1.66%
jan 1, 2008
46.116
-0.617
-1.32%
jan 1, 2009
47.889
+1.773
3.84%
jan 1, 2010
35.338
-12.551
-26.21%
jan 1, 2011
35.046
-0.292
-0.83%
jan 1, 2012
36.594
+1.549
4.42%
jan 1, 2013
35.975
-0.62
-1.69%
jan 1, 2014
34.358
-1.617
-4.49%
jan 1, 2015
34.979
+0.621
1.81%
jan 1, 2016
32.246
-2.734
-7.81%
Ranking of countries by current statistics by years


Comments: