29
/
en
AIzaSyAYiBZKx7MnpbEhh9jyipgxe19OcubqV5w
April 1, 2024
222310
Peru
PER
true
2
1
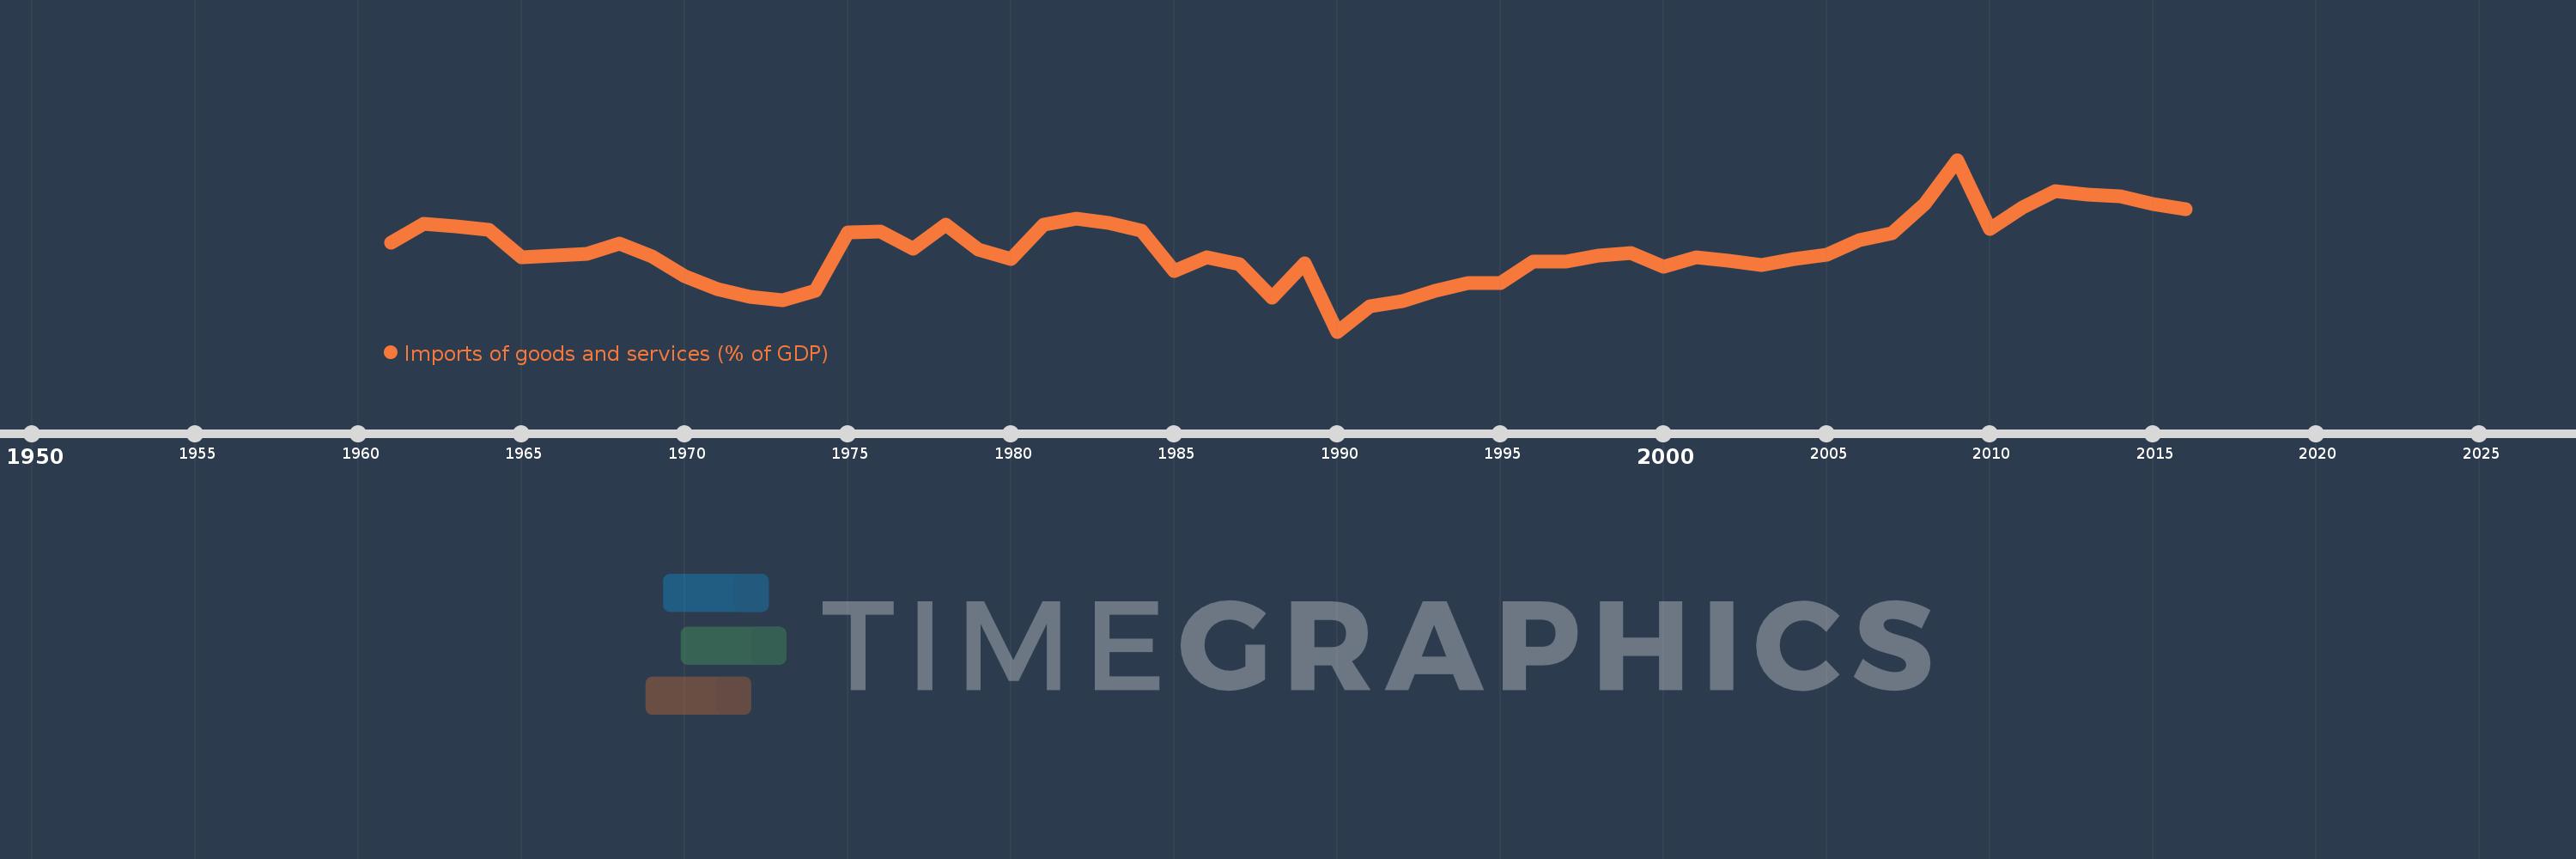
Imports of goods and services (% of GDP)
2016,2015,2014,2013,2012,2011,2010,2009,2008,2007,2006,2005,2004,2003,2002,2001,2000,1999,1998,1997,1996,1995,1994,1993,1992,1991,1990,1989,1988,1987,1986,1985,1984,1983,1982,1981,1980,1979,1978,1977,1976,1975,1974,1973,1972,1971,1970,1969,1968,1967,1966,1965,1964,1963,1962,1961
This statistics in other country:
AfghanistanAlbaniaAlgeriaAngolaAntigua and BarbudaArab WorldArgentinaArmeniaArubaAustraliaAustriaAzerbaijanBahamas, TheBahrainBangladeshBarbadosBelarusBelgiumBelizeBeninBermudaBhutanBoliviaBosnia and HerzegovinaBotswanaBrazilBrunei DarussalamBulgariaBurkina FasoBurundiCabo VerdeCambodiaCameroonCanadaCaribbean small statesCentral African RepublicCentral Europe and the BalticsChadChileChinaColombiaComorosCongo, Dem. Rep.Congo, Rep.Costa RicaCote d'IvoireCroatiaCubaCyprusCzech RepublicDenmarkDjiboutiDominicaDominican RepublicEarly-demographic dividendEast Asia & PacificEast Asia & Pacific (excluding high income)East Asia & Pacific (IDA & IBRD countries)EcuadorEgypt, Arab Rep.El SalvadorEquatorial GuineaEritreaEstoniaEthiopiaEuro areaEurope & Central AsiaEurope & Central Asia (excluding high income)Europe & Central Asia (IDA & IBRD countries)European UnionFaroe IslandsFijiFinlandFragile and conflict affected situationsFranceFrench PolynesiaGabonGambia, TheGeorgiaGermanyGhanaGreeceGrenadaGuatemalaGuineaGuinea-BissauGuyanaHaitiHeavily indebted poor countries (HIPC)High incomeHondurasHong Kong SAR, ChinaHungaryIBRD onlyIcelandIDA & IBRD totalIDA blendIDA onlyIDA totalIndiaIndonesiaIran, Islamic Rep.IraqIrelandIsraelItalyJamaicaJapanJordanKazakhstanKenyaKiribatiKorea, Rep.KosovoKuwaitKyrgyz RepublicLao PDRLate-demographic dividendLatin America & Caribbean Latin America & Caribbean (excluding high income)Latin America & the Caribbean (IDA & IBRD countries)LatviaLeast developed countries: UN classificationLebanonLesothoLiberiaLibyaLithuaniaLow & middle incomeLow incomeLower middle incomeLuxembourgMacao SAR, ChinaMacedonia, FYRMadagascarMalawiMalaysiaMaldivesMaliMaltaMauritaniaMauritiusMexicoMicronesia, Fed. Sts.Middle East & North AfricaMiddle East & North Africa (excluding high income)Middle East & North Africa (IDA & IBRD countries)Middle incomeMoldovaMongoliaMontenegroMoroccoMozambiqueMyanmarNamibiaNepalNetherlandsNew CaledoniaNew ZealandNicaraguaNigerNigeriaNorth AmericaNorwayOECD membersOmanOther small statesPacific island small statesPakistanPalauPanamaPapua New GuineaParaguayPeruPhilippinesPolandPortugalPost-demographic dividendPre-demographic dividendPuerto RicoQatarRomaniaRussian FederationRwandaSamoaSaudi ArabiaSenegalSerbiaSeychellesSierra LeoneSingaporeSlovak RepublicSloveniaSmall statesSolomon IslandsSomaliaSouth AfricaSouth AsiaSouth Asia (IDA & IBRD)South SudanSpainSri LankaSt. Kitts and NevisSt. LuciaSt. Vincent and the GrenadinesSub-Saharan Africa Sub-Saharan Africa (excluding high income)Sub-Saharan Africa (IDA & IBRD countries)SudanSurinameSwazilandSwedenSwitzerlandSyrian Arab RepublicTajikistanTanzaniaThailandTimor-LesteTogoTongaTrinidad and TobagoTunisiaTurkeyTurkmenistanUgandaUkraineUnited Arab EmiratesUnited KingdomUnited StatesUpper middle incomeUruguayUzbekistanVanuatuVenezuela, RBVietnamWest Bank and GazaWorldYemen, Rep.ZambiaZimbabwe Timeline:
This timeline shows a graph from 1961 to 2016 of Peru. No data until 1960. Number of actual observations by date: 56.
Source name:
World Development Indicators
Source organization:
World Bank national accounts data, and OECD National Accounts data files.
Categories, topics:
Economy & Growth, Trade
Last updated:
apr 23, 2017
Indicators value changes by year
Minimum:
11.207
jan 1, 1990
Maximum:
28.706
jan 1, 2009
At the date of observation
Value
Absolute change
Change from previous value
jan 1, 1961
20.271
+20.271
0.0%
jan 1, 1962
22.2
+1.93
9.52%
jan 1, 1963
21.96
-0.24
-1.08%
jan 1, 1964
21.579
-0.381
-1.73%
jan 1, 1965
18.799
-2.78
-12.88%
jan 1, 1966
18.993
+0.194
1.03%
jan 1, 1967
19.164
+0.171
0.9%
jan 1, 1968
20.174
+1.01
5.27%
jan 1, 1969
18.875
-1.299
-6.44%
jan 1, 1970
16.822
-2.053
-10.88%
jan 1, 1971
15.576
-1.246
-7.41%
jan 1, 1972
14.775
-0.8
-5.14%
jan 1, 1973
14.397
-0.378
-2.56%
jan 1, 1974
15.347
+0.95
6.6%
jan 1, 1975
21.349
+6.002
39.11%
jan 1, 1976
21.36
+0.011
0.05%
jan 1, 1977
19.69
-1.67
-7.82%
jan 1, 1978
22.119
+2.429
12.34%
jan 1, 1979
19.528
-2.591
-11.71%
jan 1, 1980
18.582
-0.946
-4.84%
jan 1, 1981
22.123
+3.541
19.05%
jan 1, 1982
22.718
+0.595
2.69%
jan 1, 1983
22.252
-0.466
-2.05%
jan 1, 1984
21.502
-0.75
-3.37%
jan 1, 1985
17.374
-4.128
-19.2%
jan 1, 1986
18.734
+1.36
7.83%
jan 1, 1987
18.074
-0.66
-3.52%
jan 1, 1988
14.685
-3.388
-18.75%
jan 1, 1989
18.122
+3.437
23.4%
jan 1, 1990
11.207
-6.915
-38.16%
jan 1, 1991
13.772
+2.565
22.89%
jan 1, 1992
14.319
+0.547
3.97%
jan 1, 1993
15.39
+1.071
7.48%
jan 1, 1994
16.165
+0.775
5.03%
jan 1, 1995
16.152
-0.013
-0.08%
jan 1, 1996
18.327
+2.176
13.47%
jan 1, 1997
18.338
+0.01
0.06%
jan 1, 1998
18.992
+0.655
3.57%
jan 1, 1999
19.25
+0.258
1.36%
jan 1, 2000
17.809
-1.441
-7.49%
jan 1, 2001
18.77
+0.961
5.39%
jan 1, 2002
18.463
-0.307
-1.63%
jan 1, 2003
17.974
-0.489
-2.65%
jan 1, 2004
18.61
+0.636
3.54%
jan 1, 2005
19.024
+0.414
2.22%
jan 1, 2006
20.509
+1.485
7.8%
jan 1, 2007
21.248
+0.74
3.61%
jan 1, 2008
24.166
+2.918
13.73%
jan 1, 2009
28.706
+4.54
18.79%
jan 1, 2010
21.67
-7.036
-24.51%
jan 1, 2011
23.847
+2.177
10.05%
jan 1, 2012
25.486
+1.639
6.87%
jan 1, 2013
25.17
-0.315
-1.24%
jan 1, 2014
24.974
-0.197
-0.78%
jan 1, 2015
24.215
-0.759
-3.04%
jan 1, 2016
23.71
-0.504
-2.08%
Ranking of countries by current statistics by years


Comments: