29
/
en
AIzaSyAYiBZKx7MnpbEhh9jyipgxe19OcubqV5w
April 1, 2024
235898
Senegal
SEN
true
2
1
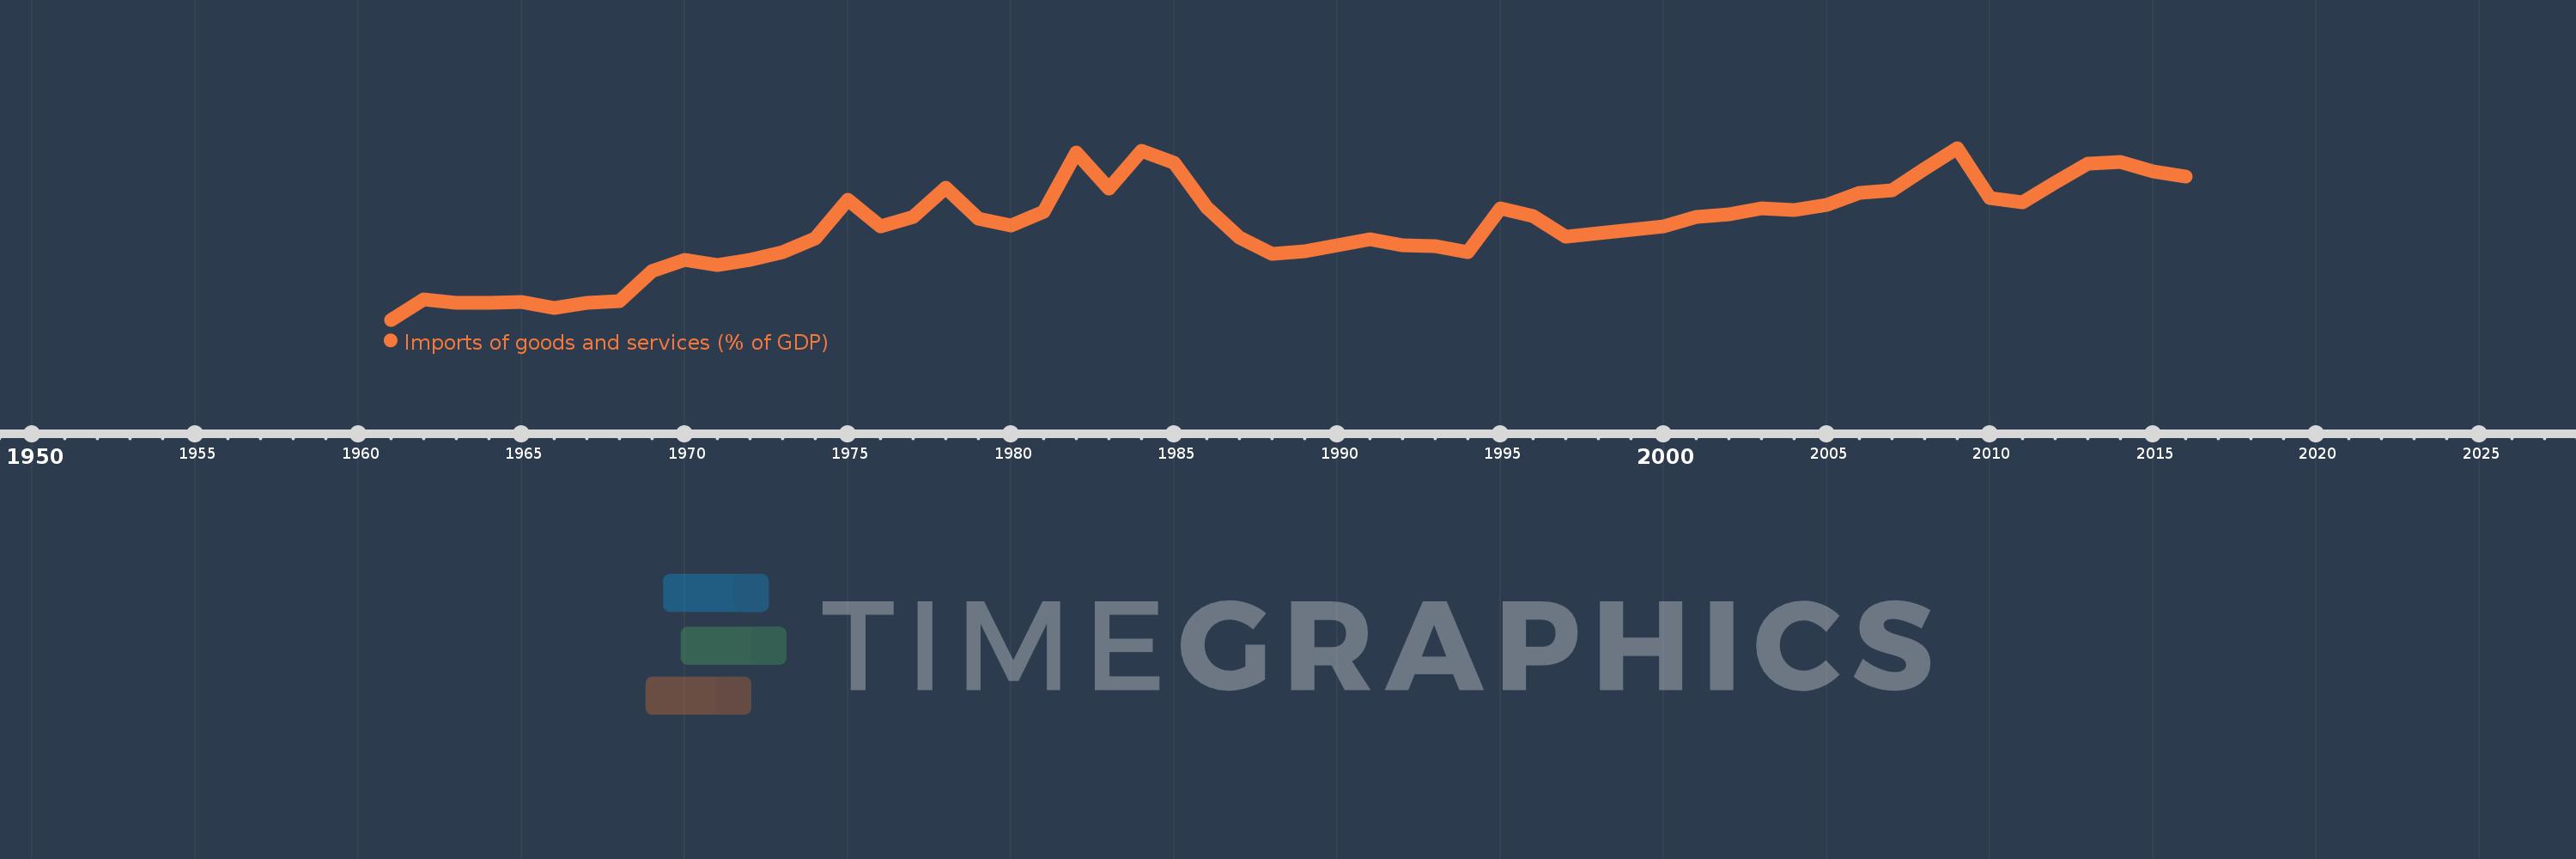
Imports of goods and services (% of GDP)
2016,2015,2014,2013,2012,2011,2010,2009,2008,2007,2006,2005,2004,2003,2002,2001,2000,1999,1998,1997,1996,1995,1994,1993,1992,1991,1990,1989,1988,1987,1986,1985,1984,1983,1982,1981,1980,1979,1978,1977,1976,1975,1974,1973,1972,1971,1970,1969,1968,1967,1966,1965,1964,1963,1962,1961
This statistics in other country:
AfghanistanAlbaniaAlgeriaAngolaAntigua and BarbudaArab WorldArgentinaArmeniaArubaAustraliaAustriaAzerbaijanBahamas, TheBahrainBangladeshBarbadosBelarusBelgiumBelizeBeninBermudaBhutanBoliviaBosnia and HerzegovinaBotswanaBrazilBrunei DarussalamBulgariaBurkina FasoBurundiCabo VerdeCambodiaCameroonCanadaCaribbean small statesCentral African RepublicCentral Europe and the BalticsChadChileChinaColombiaComorosCongo, Dem. Rep.Congo, Rep.Costa RicaCote d'IvoireCroatiaCubaCyprusCzech RepublicDenmarkDjiboutiDominicaDominican RepublicEarly-demographic dividendEast Asia & PacificEast Asia & Pacific (excluding high income)East Asia & Pacific (IDA & IBRD countries)EcuadorEgypt, Arab Rep.El SalvadorEquatorial GuineaEritreaEstoniaEthiopiaEuro areaEurope & Central AsiaEurope & Central Asia (excluding high income)Europe & Central Asia (IDA & IBRD countries)European UnionFaroe IslandsFijiFinlandFragile and conflict affected situationsFranceFrench PolynesiaGabonGambia, TheGeorgiaGermanyGhanaGreeceGrenadaGuatemalaGuineaGuinea-BissauGuyanaHaitiHeavily indebted poor countries (HIPC)High incomeHondurasHong Kong SAR, ChinaHungaryIBRD onlyIcelandIDA & IBRD totalIDA blendIDA onlyIDA totalIndiaIndonesiaIran, Islamic Rep.IraqIrelandIsraelItalyJamaicaJapanJordanKazakhstanKenyaKiribatiKorea, Rep.KosovoKuwaitKyrgyz RepublicLao PDRLate-demographic dividendLatin America & Caribbean Latin America & Caribbean (excluding high income)Latin America & the Caribbean (IDA & IBRD countries)LatviaLeast developed countries: UN classificationLebanonLesothoLiberiaLibyaLithuaniaLow & middle incomeLow incomeLower middle incomeLuxembourgMacao SAR, ChinaMacedonia, FYRMadagascarMalawiMalaysiaMaldivesMaliMaltaMauritaniaMauritiusMexicoMicronesia, Fed. Sts.Middle East & North AfricaMiddle East & North Africa (excluding high income)Middle East & North Africa (IDA & IBRD countries)Middle incomeMoldovaMongoliaMontenegroMoroccoMozambiqueMyanmarNamibiaNepalNetherlandsNew CaledoniaNew ZealandNicaraguaNigerNigeriaNorth AmericaNorwayOECD membersOmanOther small statesPacific island small statesPakistanPalauPanamaPapua New GuineaParaguayPeruPhilippinesPolandPortugalPost-demographic dividendPre-demographic dividendPuerto RicoQatarRomaniaRussian FederationRwandaSamoaSaudi ArabiaSenegalSerbiaSeychellesSierra LeoneSingaporeSlovak RepublicSloveniaSmall statesSolomon IslandsSomaliaSouth AfricaSouth AsiaSouth Asia (IDA & IBRD)South SudanSpainSri LankaSt. Kitts and NevisSt. LuciaSt. Vincent and the GrenadinesSub-Saharan Africa Sub-Saharan Africa (excluding high income)Sub-Saharan Africa (IDA & IBRD countries)SudanSurinameSwazilandSwedenSwitzerlandSyrian Arab RepublicTajikistanTanzaniaThailandTimor-LesteTogoTongaTrinidad and TobagoTunisiaTurkeyTurkmenistanUgandaUkraineUnited Arab EmiratesUnited KingdomUnited StatesUpper middle incomeUruguayUzbekistanVanuatuVenezuela, RBVietnamWest Bank and GazaWorldYemen, Rep.ZambiaZimbabwe Timeline:
This timeline shows a graph from 1961 to 2016 of Senegal. No data until 1960. Number of actual observations by date: 56.
Source name:
World Development Indicators
Source organization:
World Bank national accounts data, and OECD National Accounts data files.
Categories, topics:
Economy & Growth, Trade
Last updated:
apr 23, 2017
Indicators value changes by year
Minimum:
14.297
jan 1, 1961
Maximum:
52.471
jan 1, 2009
At the date of observation
Value
Absolute change
Change from previous value
jan 1, 1961
14.297
+14.297
0.0%
jan 1, 1962
18.745
+4.448
31.11%
jan 1, 1963
18.113
-0.632
-3.37%
jan 1, 1964
18.005
-0.108
-0.6%
jan 1, 1965
18.221
+0.217
1.2%
jan 1, 1966
16.97
-1.252
-6.87%
jan 1, 1967
18.133
+1.164
6.86%
jan 1, 1968
18.372
+0.238
1.31%
jan 1, 1969
25.08
+6.708
36.51%
jan 1, 1970
27.537
+2.457
9.8%
jan 1, 1971
26.425
-1.112
-4.04%
jan 1, 1972
27.675
+1.25
4.73%
jan 1, 1973
29.244
+1.569
5.67%
jan 1, 1974
32.32
+3.075
10.52%
jan 1, 1975
41.023
+8.704
26.93%
jan 1, 1976
35.036
-5.987
-14.59%
jan 1, 1977
37.092
+2.056
5.87%
jan 1, 1978
43.567
+6.475
17.46%
jan 1, 1979
36.727
-6.84
-15.7%
jan 1, 1980
35.183
-1.544
-4.2%
jan 1, 1981
38.356
+3.174
9.02%
jan 1, 1982
51.506
+13.15
34.28%
jan 1, 1983
43.433
-8.073
-15.67%
jan 1, 1984
51.78
+8.347
19.22%
jan 1, 1985
49.19
-2.59
-5.0%
jan 1, 1986
39.23
-9.96
-20.25%
jan 1, 1987
32.65
-6.58
-16.77%
jan 1, 1988
28.956
-3.694
-11.32%
jan 1, 1989
29.594
+0.638
2.2%
jan 1, 1990
30.908
+1.314
4.44%
jan 1, 1991
32.186
+1.278
4.13%
jan 1, 1992
30.918
-1.268
-3.94%
jan 1, 1993
30.742
-0.176
-0.57%
jan 1, 1994
29.373
-1.369
-4.45%
jan 1, 1995
39.067
+9.694
33.0%
jan 1, 1996
37.327
-1.739
-4.45%
jan 1, 1997
32.765
-4.563
-12.22%
jan 1, 1998
33.552
+0.788
2.4%
jan 1, 1999
34.262
+0.71
2.12%
jan 1, 2000
35.054
+0.792
2.31%
jan 1, 2001
37.217
+2.163
6.17%
jan 1, 2002
37.764
+0.548
1.47%
jan 1, 2003
38.965
+1.201
3.18%
jan 1, 2004
38.736
-0.229
-0.59%
jan 1, 2005
39.769
+1.032
2.66%
jan 1, 2006
42.424
+2.655
6.68%
jan 1, 2007
43.097
+0.673
1.59%
jan 1, 2008
47.845
+4.748
11.02%
jan 1, 2009
52.471
+4.625
9.67%
jan 1, 2010
41.294
-11.177
-21.3%
jan 1, 2011
40.302
-0.991
-2.4%
jan 1, 2012
44.735
+4.432
11.0%
jan 1, 2013
48.979
+4.244
9.49%
jan 1, 2014
49.296
+0.317
0.65%
jan 1, 2015
47.284
-2.012
-4.08%
jan 1, 2016
46.109
-1.175
-2.49%
Ranking of countries by current statistics by years


Comments: