29
/
en
AIzaSyAYiBZKx7MnpbEhh9jyipgxe19OcubqV5w
April 1, 2024
24183
Arab World
ARB
false
2
1
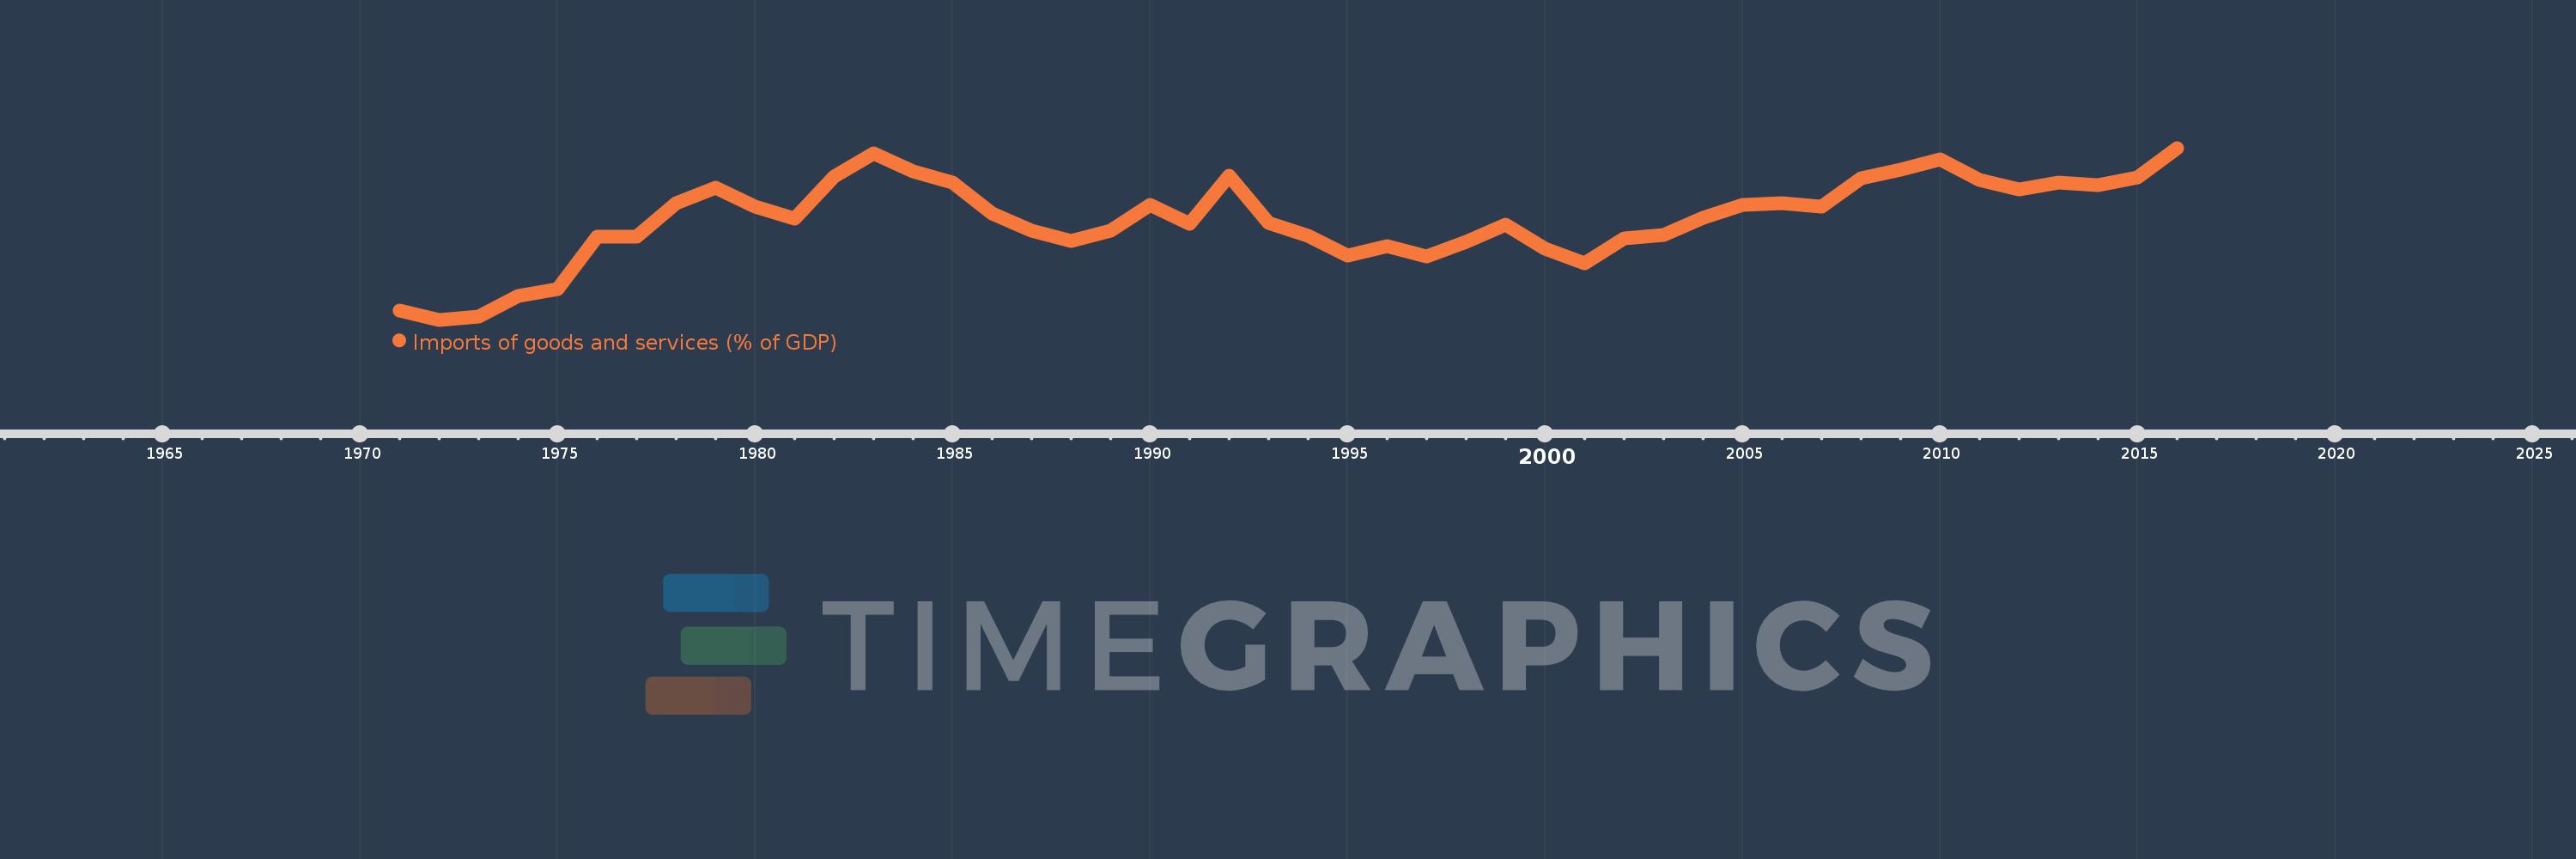
Imports of goods and services (% of GDP)
2016,2015,2014,2013,2012,2011,2010,2009,2008,2007,2006,2005,2004,2003,2002,2001,2000,1999,1998,1997,1996,1995,1994,1993,1992,1991,1990,1989,1988,1987,1986,1985,1984,1983,1982,1981,1980,1979,1978,1977,1976,1975,1974,1973,1972,1971
This statistics in other country:
AfghanistanAlbaniaAlgeriaAngolaAntigua and BarbudaArab WorldArgentinaArmeniaArubaAustraliaAustriaAzerbaijanBahamas, TheBahrainBangladeshBarbadosBelarusBelgiumBelizeBeninBermudaBhutanBoliviaBosnia and HerzegovinaBotswanaBrazilBrunei DarussalamBulgariaBurkina FasoBurundiCabo VerdeCambodiaCameroonCanadaCaribbean small statesCentral African RepublicCentral Europe and the BalticsChadChileChinaColombiaComorosCongo, Dem. Rep.Congo, Rep.Costa RicaCote d'IvoireCroatiaCubaCyprusCzech RepublicDenmarkDjiboutiDominicaDominican RepublicEarly-demographic dividendEast Asia & PacificEast Asia & Pacific (excluding high income)East Asia & Pacific (IDA & IBRD countries)EcuadorEgypt, Arab Rep.El SalvadorEquatorial GuineaEritreaEstoniaEthiopiaEuro areaEurope & Central AsiaEurope & Central Asia (excluding high income)Europe & Central Asia (IDA & IBRD countries)European UnionFaroe IslandsFijiFinlandFragile and conflict affected situationsFranceFrench PolynesiaGabonGambia, TheGeorgiaGermanyGhanaGreeceGrenadaGuatemalaGuineaGuinea-BissauGuyanaHaitiHeavily indebted poor countries (HIPC)High incomeHondurasHong Kong SAR, ChinaHungaryIBRD onlyIcelandIDA & IBRD totalIDA blendIDA onlyIDA totalIndiaIndonesiaIran, Islamic Rep.IraqIrelandIsraelItalyJamaicaJapanJordanKazakhstanKenyaKiribatiKorea, Rep.KosovoKuwaitKyrgyz RepublicLao PDRLate-demographic dividendLatin America & Caribbean Latin America & Caribbean (excluding high income)Latin America & the Caribbean (IDA & IBRD countries)LatviaLeast developed countries: UN classificationLebanonLesothoLiberiaLibyaLithuaniaLow & middle incomeLow incomeLower middle incomeLuxembourgMacao SAR, ChinaMacedonia, FYRMadagascarMalawiMalaysiaMaldivesMaliMaltaMauritaniaMauritiusMexicoMicronesia, Fed. Sts.Middle East & North AfricaMiddle East & North Africa (excluding high income)Middle East & North Africa (IDA & IBRD countries)Middle incomeMoldovaMongoliaMontenegroMoroccoMozambiqueMyanmarNamibiaNepalNetherlandsNew CaledoniaNew ZealandNicaraguaNigerNigeriaNorth AmericaNorwayOECD membersOmanOther small statesPacific island small statesPakistanPalauPanamaPapua New GuineaParaguayPeruPhilippinesPolandPortugalPost-demographic dividendPre-demographic dividendPuerto RicoQatarRomaniaRussian FederationRwandaSamoaSaudi ArabiaSenegalSerbiaSeychellesSierra LeoneSingaporeSlovak RepublicSloveniaSmall statesSolomon IslandsSomaliaSouth AfricaSouth AsiaSouth Asia (IDA & IBRD)South SudanSpainSri LankaSt. Kitts and NevisSt. LuciaSt. Vincent and the GrenadinesSub-Saharan Africa Sub-Saharan Africa (excluding high income)Sub-Saharan Africa (IDA & IBRD countries)SudanSurinameSwazilandSwedenSwitzerlandSyrian Arab RepublicTajikistanTanzaniaThailandTimor-LesteTogoTongaTrinidad and TobagoTunisiaTurkeyTurkmenistanUgandaUkraineUnited Arab EmiratesUnited KingdomUnited StatesUpper middle incomeUruguayUzbekistanVanuatuVenezuela, RBVietnamWest Bank and GazaWorldYemen, Rep.ZambiaZimbabwe Timeline:
This timeline shows a graph from 1971 to 2016 of Arab World. No data until 1970. Number of actual observations by date: 46.
Source name:
World Development Indicators
Source organization:
World Bank national accounts data, and OECD National Accounts data files.
Categories, topics:
Economy & Growth, Trade
Last updated:
apr 23, 2017
Indicators value changes by year
Minimum:
20.676
jan 1, 1972
Maximum:
43.835
jan 1, 2016
At the date of observation
Value
Absolute change
Change from previous value
jan 1, 1971
21.958
+21.958
0.0%
jan 1, 1972
20.676
-1.282
-5.84%
jan 1, 1973
21.138
+0.462
2.24%
jan 1, 1974
23.903
+2.765
13.08%
jan 1, 1975
24.778
+0.875
3.66%
jan 1, 1976
31.863
+7.084
28.59%
jan 1, 1977
31.909
+0.046
0.15%
jan 1, 1978
36.351
+4.442
13.92%
jan 1, 1979
38.524
+2.173
5.98%
jan 1, 1980
35.915
-2.609
-6.77%
jan 1, 1981
34.274
-1.641
-4.57%
jan 1, 1982
40.03
+5.756
16.79%
jan 1, 1983
43.108
+3.078
7.69%
jan 1, 1984
40.646
-2.463
-5.71%
jan 1, 1985
39.225
-1.421
-3.5%
jan 1, 1986
35.01
-4.214
-10.74%
jan 1, 1987
32.679
-2.332
-6.66%
jan 1, 1988
31.238
-1.441
-4.41%
jan 1, 1989
32.657
+1.419
4.54%
jan 1, 1990
36.163
+3.505
10.73%
jan 1, 1991
33.588
-2.575
-7.12%
jan 1, 1992
40.133
+6.546
19.49%
jan 1, 1993
33.775
-6.358
-15.84%
jan 1, 1994
31.99
-1.785
-5.28%
jan 1, 1995
29.294
-2.696
-8.43%
jan 1, 1996
30.62
+1.326
4.53%
jan 1, 1997
29.252
-1.369
-4.47%
jan 1, 1998
31.159
+1.907
6.52%
jan 1, 1999
33.472
+2.314
7.43%
jan 1, 2000
30.254
-3.218
-9.61%
jan 1, 2001
28.303
-1.951
-6.45%
jan 1, 2002
31.587
+3.284
11.6%
jan 1, 2003
32.142
+0.555
1.76%
jan 1, 2004
34.381
+2.239
6.97%
jan 1, 2005
36.157
+1.775
5.16%
jan 1, 2006
36.431
+0.274
0.76%
jan 1, 2007
35.886
-0.545
-1.5%
jan 1, 2008
39.726
+3.84
10.7%
jan 1, 2009
40.879
+1.153
2.9%
jan 1, 2010
42.296
+1.418
3.47%
jan 1, 2011
39.487
-2.809
-6.64%
jan 1, 2012
38.241
-1.246
-3.16%
jan 1, 2013
39.17
+0.928
2.43%
jan 1, 2014
38.875
-0.294
-0.75%
jan 1, 2015
39.844
+0.968
2.49%
jan 1, 2016
43.835
+3.991
10.02%
Ranking of countries by current statistics by years


Comments: