29
/
en
AIzaSyAYiBZKx7MnpbEhh9jyipgxe19OcubqV5w
April 1, 2024
91271
Brazil
BRA
true
2
1
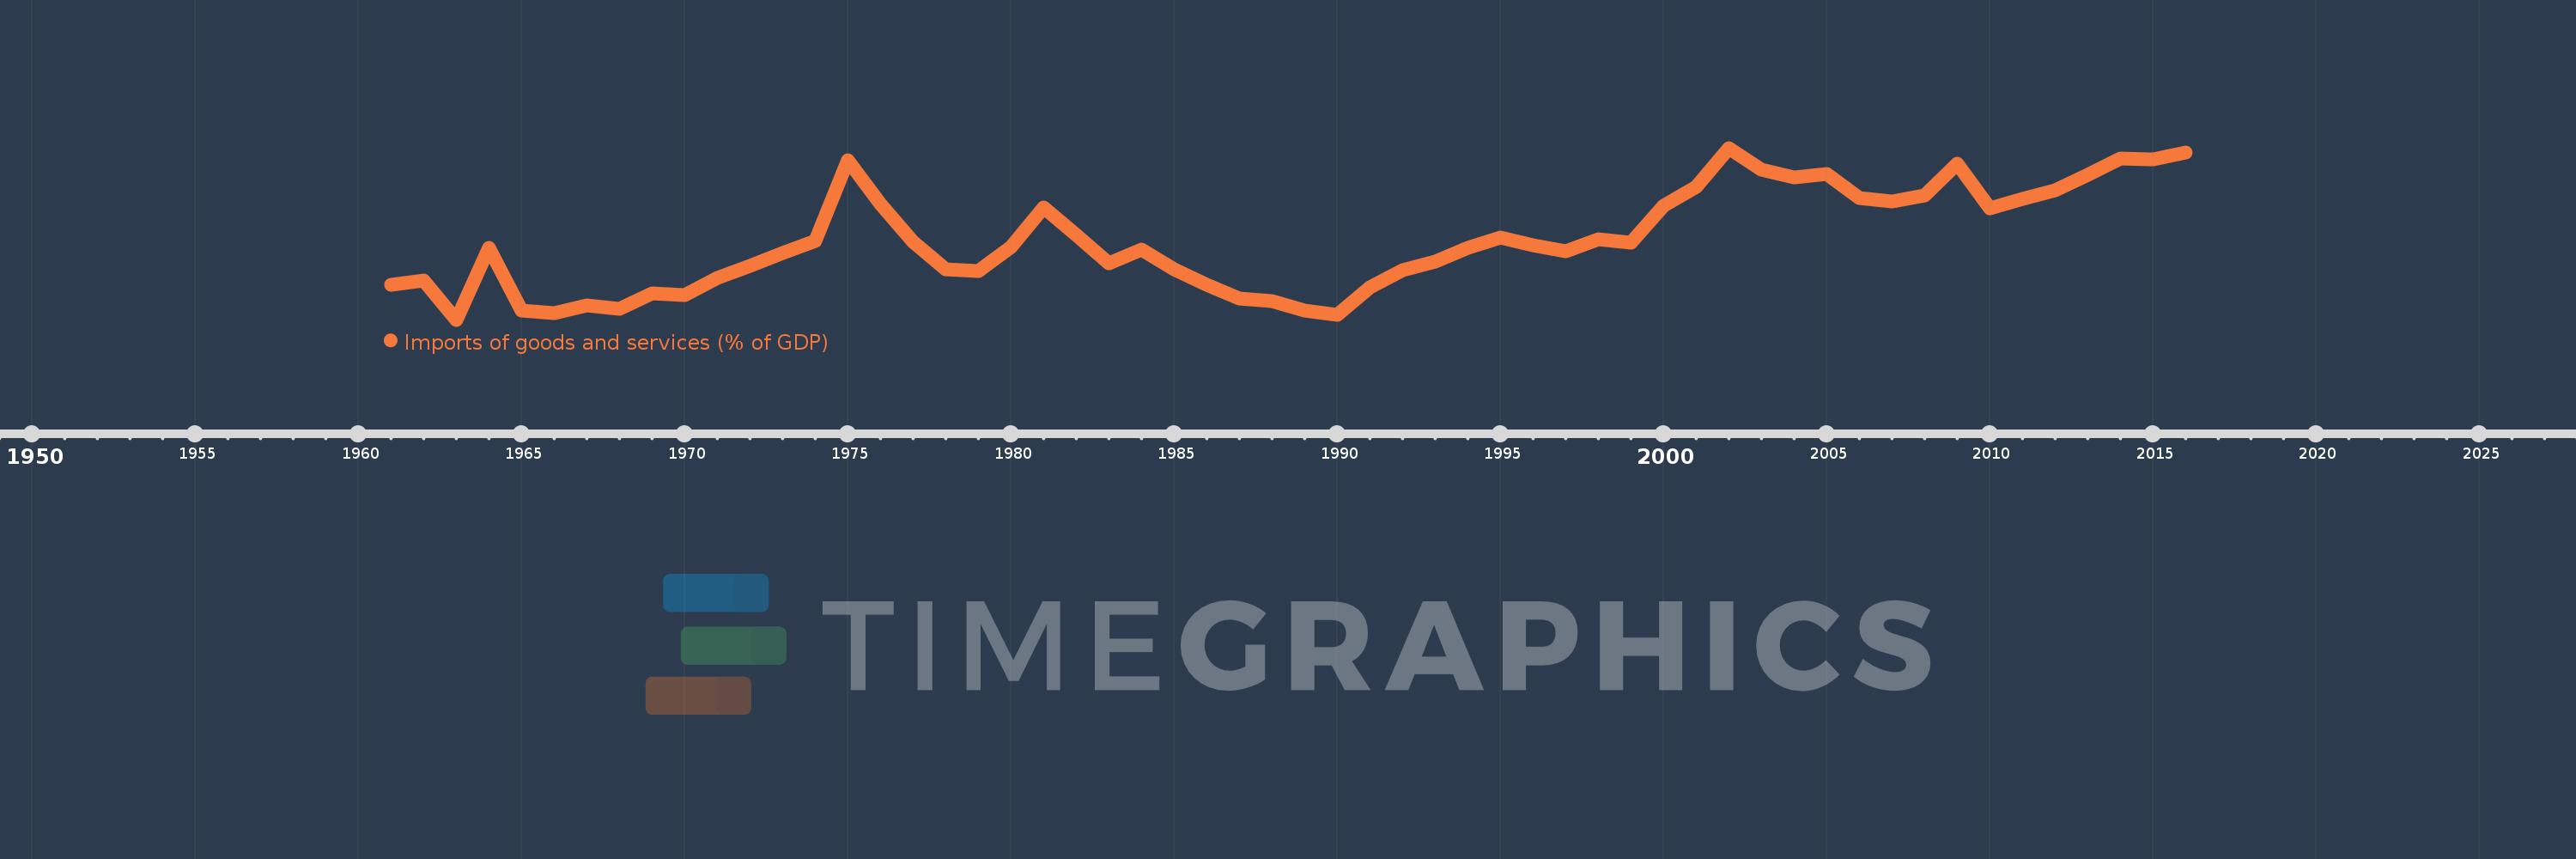
Imports of goods and services (% of GDP)
2016,2015,2014,2013,2012,2011,2010,2009,2008,2007,2006,2005,2004,2003,2002,2001,2000,1999,1998,1997,1996,1995,1994,1993,1992,1991,1990,1989,1988,1987,1986,1985,1984,1983,1982,1981,1980,1979,1978,1977,1976,1975,1974,1973,1972,1971,1970,1969,1968,1967,1966,1965,1964,1963,1962,1961
This statistics in other country:
AfghanistanAlbaniaAlgeriaAngolaAntigua and BarbudaArab WorldArgentinaArmeniaArubaAustraliaAustriaAzerbaijanBahamas, TheBahrainBangladeshBarbadosBelarusBelgiumBelizeBeninBermudaBhutanBoliviaBosnia and HerzegovinaBotswanaBrazilBrunei DarussalamBulgariaBurkina FasoBurundiCabo VerdeCambodiaCameroonCanadaCaribbean small statesCentral African RepublicCentral Europe and the BalticsChadChileChinaColombiaComorosCongo, Dem. Rep.Congo, Rep.Costa RicaCote d'IvoireCroatiaCubaCyprusCzech RepublicDenmarkDjiboutiDominicaDominican RepublicEarly-demographic dividendEast Asia & PacificEast Asia & Pacific (excluding high income)East Asia & Pacific (IDA & IBRD countries)EcuadorEgypt, Arab Rep.El SalvadorEquatorial GuineaEritreaEstoniaEthiopiaEuro areaEurope & Central AsiaEurope & Central Asia (excluding high income)Europe & Central Asia (IDA & IBRD countries)European UnionFaroe IslandsFijiFinlandFragile and conflict affected situationsFranceFrench PolynesiaGabonGambia, TheGeorgiaGermanyGhanaGreeceGrenadaGuatemalaGuineaGuinea-BissauGuyanaHaitiHeavily indebted poor countries (HIPC)High incomeHondurasHong Kong SAR, ChinaHungaryIBRD onlyIcelandIDA & IBRD totalIDA blendIDA onlyIDA totalIndiaIndonesiaIran, Islamic Rep.IraqIrelandIsraelItalyJamaicaJapanJordanKazakhstanKenyaKiribatiKorea, Rep.KosovoKuwaitKyrgyz RepublicLao PDRLate-demographic dividendLatin America & Caribbean Latin America & Caribbean (excluding high income)Latin America & the Caribbean (IDA & IBRD countries)LatviaLeast developed countries: UN classificationLebanonLesothoLiberiaLibyaLithuaniaLow & middle incomeLow incomeLower middle incomeLuxembourgMacao SAR, ChinaMacedonia, FYRMadagascarMalawiMalaysiaMaldivesMaliMaltaMauritaniaMauritiusMexicoMicronesia, Fed. Sts.Middle East & North AfricaMiddle East & North Africa (excluding high income)Middle East & North Africa (IDA & IBRD countries)Middle incomeMoldovaMongoliaMontenegroMoroccoMozambiqueMyanmarNamibiaNepalNetherlandsNew CaledoniaNew ZealandNicaraguaNigerNigeriaNorth AmericaNorwayOECD membersOmanOther small statesPacific island small statesPakistanPalauPanamaPapua New GuineaParaguayPeruPhilippinesPolandPortugalPost-demographic dividendPre-demographic dividendPuerto RicoQatarRomaniaRussian FederationRwandaSamoaSaudi ArabiaSenegalSerbiaSeychellesSierra LeoneSingaporeSlovak RepublicSloveniaSmall statesSolomon IslandsSomaliaSouth AfricaSouth AsiaSouth Asia (IDA & IBRD)South SudanSpainSri LankaSt. Kitts and NevisSt. LuciaSt. Vincent and the GrenadinesSub-Saharan Africa Sub-Saharan Africa (excluding high income)Sub-Saharan Africa (IDA & IBRD countries)SudanSurinameSwazilandSwedenSwitzerlandSyrian Arab RepublicTajikistanTanzaniaThailandTimor-LesteTogoTongaTrinidad and TobagoTunisiaTurkeyTurkmenistanUgandaUkraineUnited Arab EmiratesUnited KingdomUnited StatesUpper middle incomeUruguayUzbekistanVanuatuVenezuela, RBVietnamWest Bank and GazaWorldYemen, Rep.ZambiaZimbabwe Timeline:
This timeline shows a graph from 1961 to 2016 of Brazil. No data until 1960. Number of actual observations by date: 56.
Source name:
World Development Indicators
Source organization:
World Bank national accounts data, and OECD National Accounts data files.
Categories, topics:
Economy & Growth, Trade
Last updated:
apr 23, 2017
Indicators value changes by year
Maximum:
14.565
jan 1, 2002
At the date of observation
Value
Absolute change
Change from previous value
jan 1, 1961
7.117
+7.117
0.0%
jan 1, 1962
7.339
+0.222
3.12%
jan 1, 1963
5.189
-2.15
-29.3%
jan 1, 1964
9.111
+3.922
75.58%
jan 1, 1965
5.678
-3.433
-37.68%
jan 1, 1966
5.556
-0.122
-2.14%
jan 1, 1967
5.992
+0.436
7.84%
jan 1, 1968
5.769
-0.223
-3.72%
jan 1, 1969
6.61
+0.841
14.59%
jan 1, 1970
6.554
-0.057
-0.86%
jan 1, 1971
7.45
+0.896
13.67%
jan 1, 1972
8.138
+0.688
9.24%
jan 1, 1973
8.844
+0.706
8.68%
jan 1, 1974
9.502
+0.658
7.43%
jan 1, 1975
13.884
+4.382
46.12%
jan 1, 1976
11.506
-2.378
-17.13%
jan 1, 1977
9.433
-2.073
-18.02%
jan 1, 1978
7.918
-1.515
-16.06%
jan 1, 1979
7.864
-0.053
-0.67%
jan 1, 1980
9.176
+1.311
16.67%
jan 1, 1981
11.306
+2.13
23.22%
jan 1, 1982
9.799
-1.506
-13.32%
jan 1, 1983
8.274
-1.525
-15.56%
jan 1, 1984
9.008
+0.734
8.87%
jan 1, 1985
7.924
-1.084
-12.03%
jan 1, 1986
7.095
-0.829
-10.46%
jan 1, 1987
6.355
-0.741
-10.44%
jan 1, 1988
6.193
-0.162
-2.55%
jan 1, 1989
5.693
-0.5
-8.08%
jan 1, 1990
5.461
-0.231
-4.06%
jan 1, 1991
6.962
+1.5
27.48%
jan 1, 1992
7.914
+0.952
13.68%
jan 1, 1993
8.385
+0.471
5.95%
jan 1, 1994
9.096
+0.711
8.48%
jan 1, 1995
9.668
+0.572
6.29%
jan 1, 1996
9.26
-0.408
-4.22%
jan 1, 1997
8.905
-0.355
-3.83%
jan 1, 1998
9.592
+0.687
7.72%
jan 1, 1999
9.408
-0.184
-1.92%
jan 1, 2000
11.417
+2.009
21.36%
jan 1, 2001
12.452
+1.034
9.06%
jan 1, 2002
14.565
+2.113
16.97%
jan 1, 2003
13.388
-1.177
-8.08%
jan 1, 2004
12.96
-0.428
-3.2%
jan 1, 2005
13.132
+0.173
1.33%
jan 1, 2006
11.843
-1.289
-9.82%
jan 1, 2007
11.667
-0.176
-1.48%
jan 1, 2008
11.965
+0.298
2.55%
jan 1, 2009
13.724
+1.759
14.7%
jan 1, 2010
11.255
-2.469
-17.99%
jan 1, 2011
11.779
+0.525
4.66%
jan 1, 2012
12.243
+0.464
3.94%
jan 1, 2013
13.086
+0.843
6.89%
jan 1, 2014
13.971
+0.885
6.76%
jan 1, 2015
13.921
-0.051
-0.36%
jan 1, 2016
14.325
+0.404
2.9%
Ranking of countries by current statistics by years


Comments: