29
/
en
AIzaSyAYiBZKx7MnpbEhh9jyipgxe19OcubqV5w
April 1, 2024
100045
Cameroon
CMR
true
2
1
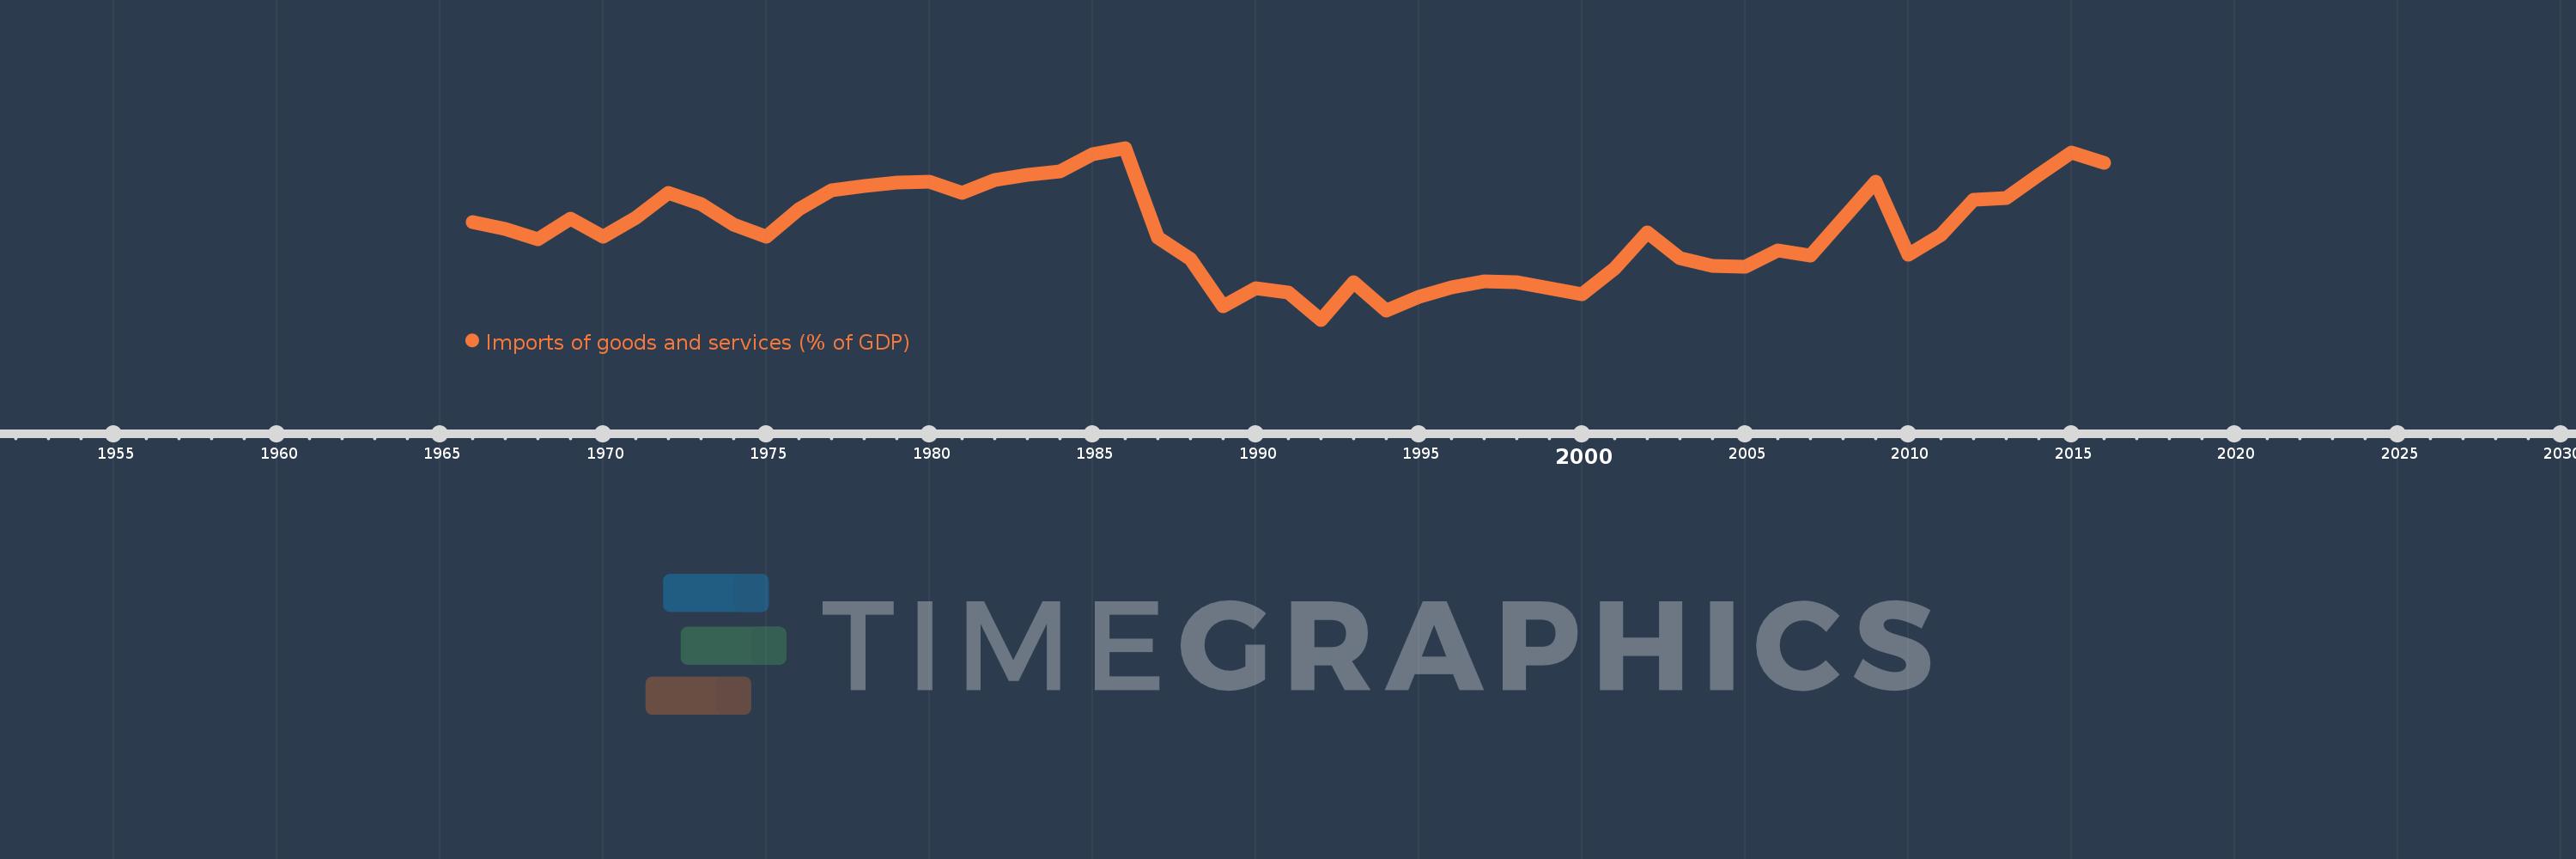
Imports of goods and services (% of GDP)
2016,2015,2014,2013,2012,2011,2010,2009,2008,2007,2006,2005,2004,2003,2002,2001,2000,1999,1998,1997,1996,1995,1994,1993,1992,1991,1990,1989,1988,1987,1986,1985,1984,1983,1982,1981,1980,1979,1978,1977,1976,1975,1974,1973,1972,1971,1970,1969,1968,1967,1966
This statistics in other country:
AfghanistanAlbaniaAlgeriaAngolaAntigua and BarbudaArab WorldArgentinaArmeniaArubaAustraliaAustriaAzerbaijanBahamas, TheBahrainBangladeshBarbadosBelarusBelgiumBelizeBeninBermudaBhutanBoliviaBosnia and HerzegovinaBotswanaBrazilBrunei DarussalamBulgariaBurkina FasoBurundiCabo VerdeCambodiaCameroonCanadaCaribbean small statesCentral African RepublicCentral Europe and the BalticsChadChileChinaColombiaComorosCongo, Dem. Rep.Congo, Rep.Costa RicaCote d'IvoireCroatiaCubaCyprusCzech RepublicDenmarkDjiboutiDominicaDominican RepublicEarly-demographic dividendEast Asia & PacificEast Asia & Pacific (excluding high income)East Asia & Pacific (IDA & IBRD countries)EcuadorEgypt, Arab Rep.El SalvadorEquatorial GuineaEritreaEstoniaEthiopiaEuro areaEurope & Central AsiaEurope & Central Asia (excluding high income)Europe & Central Asia (IDA & IBRD countries)European UnionFaroe IslandsFijiFinlandFragile and conflict affected situationsFranceFrench PolynesiaGabonGambia, TheGeorgiaGermanyGhanaGreeceGrenadaGuatemalaGuineaGuinea-BissauGuyanaHaitiHeavily indebted poor countries (HIPC)High incomeHondurasHong Kong SAR, ChinaHungaryIBRD onlyIcelandIDA & IBRD totalIDA blendIDA onlyIDA totalIndiaIndonesiaIran, Islamic Rep.IraqIrelandIsraelItalyJamaicaJapanJordanKazakhstanKenyaKiribatiKorea, Rep.KosovoKuwaitKyrgyz RepublicLao PDRLate-demographic dividendLatin America & Caribbean Latin America & Caribbean (excluding high income)Latin America & the Caribbean (IDA & IBRD countries)LatviaLeast developed countries: UN classificationLebanonLesothoLiberiaLibyaLithuaniaLow & middle incomeLow incomeLower middle incomeLuxembourgMacao SAR, ChinaMacedonia, FYRMadagascarMalawiMalaysiaMaldivesMaliMaltaMauritaniaMauritiusMexicoMicronesia, Fed. Sts.Middle East & North AfricaMiddle East & North Africa (excluding high income)Middle East & North Africa (IDA & IBRD countries)Middle incomeMoldovaMongoliaMontenegroMoroccoMozambiqueMyanmarNamibiaNepalNetherlandsNew CaledoniaNew ZealandNicaraguaNigerNigeriaNorth AmericaNorwayOECD membersOmanOther small statesPacific island small statesPakistanPalauPanamaPapua New GuineaParaguayPeruPhilippinesPolandPortugalPost-demographic dividendPre-demographic dividendPuerto RicoQatarRomaniaRussian FederationRwandaSamoaSaudi ArabiaSenegalSerbiaSeychellesSierra LeoneSingaporeSlovak RepublicSloveniaSmall statesSolomon IslandsSomaliaSouth AfricaSouth AsiaSouth Asia (IDA & IBRD)South SudanSpainSri LankaSt. Kitts and NevisSt. LuciaSt. Vincent and the GrenadinesSub-Saharan Africa Sub-Saharan Africa (excluding high income)Sub-Saharan Africa (IDA & IBRD countries)SudanSurinameSwazilandSwedenSwitzerlandSyrian Arab RepublicTajikistanTanzaniaThailandTimor-LesteTogoTongaTrinidad and TobagoTunisiaTurkeyTurkmenistanUgandaUkraineUnited Arab EmiratesUnited KingdomUnited StatesUpper middle incomeUruguayUzbekistanVanuatuVenezuela, RBVietnamWest Bank and GazaWorldYemen, Rep.ZambiaZimbabwe Timeline:
This timeline shows a graph from 1966 to 2016 of Cameroon. No data until 1965. Number of actual observations by date: 51.
Source name:
World Development Indicators
Source organization:
World Bank national accounts data, and OECD National Accounts data files.
Categories, topics:
Economy & Growth, Trade
Last updated:
apr 23, 2017
Indicators value changes by year
Maximum:
31.576
jan 1, 1986
At the date of observation
Value
Absolute change
Change from previous value
jan 1, 1966
24.261
+24.261
0.0%
jan 1, 1967
23.577
-0.683
-2.82%
jan 1, 1968
22.579
-0.998
-4.23%
jan 1, 1969
24.633
+2.054
9.1%
jan 1, 1970
22.859
-1.774
-7.2%
jan 1, 1971
24.67
+1.811
7.92%
jan 1, 1972
27.158
+2.488
10.08%
jan 1, 1973
26.086
-1.072
-3.95%
jan 1, 1974
23.997
-2.089
-8.01%
jan 1, 1975
22.8
-1.197
-4.99%
jan 1, 1976
25.543
+2.743
12.03%
jan 1, 1977
27.365
+1.822
7.13%
jan 1, 1978
27.806
+0.441
1.61%
jan 1, 1979
28.122
+0.316
1.14%
jan 1, 1980
28.242
+0.12
0.43%
jan 1, 1981
27.131
-1.111
-3.93%
jan 1, 1982
28.414
+1.283
4.73%
jan 1, 1983
28.911
+0.497
1.75%
jan 1, 1984
29.304
+0.393
1.36%
jan 1, 1985
30.993
+1.69
5.77%
jan 1, 1986
31.576
+0.582
1.88%
jan 1, 1987
22.724
-8.851
-28.03%
jan 1, 1988
20.626
-2.098
-9.23%
jan 1, 1989
15.962
-4.664
-22.61%
jan 1, 1990
17.769
+1.808
11.33%
jan 1, 1991
17.314
-0.456
-2.57%
jan 1, 1992
14.64
-2.674
-15.44%
jan 1, 1993
18.316
+3.676
25.11%
jan 1, 1994
15.565
-2.75
-15.02%
jan 1, 1995
16.903
+1.338
8.59%
jan 1, 1996
17.794
+0.891
5.27%
jan 1, 1997
18.392
+0.598
3.36%
jan 1, 1998
18.36
-0.032
-0.17%
jan 1, 1999
17.706
-0.654
-3.56%
jan 1, 2000
17.164
-0.542
-3.06%
jan 1, 2001
19.662
+2.497
14.55%
jan 1, 2002
23.214
+3.553
18.07%
jan 1, 2003
20.717
-2.498
-10.76%
jan 1, 2004
19.911
-0.805
-3.89%
jan 1, 2005
19.831
-0.08
-0.4%
jan 1, 2006
21.471
+1.64
8.27%
jan 1, 2007
20.953
-0.518
-2.41%
jan 1, 2008
24.605
+3.652
17.43%
jan 1, 2009
28.212
+3.607
14.66%
jan 1, 2010
21.029
-7.183
-25.46%
jan 1, 2011
23.014
+1.985
9.44%
jan 1, 2012
26.472
+3.459
15.03%
jan 1, 2013
26.608
+0.135
0.51%
jan 1, 2014
28.909
+2.302
8.65%
jan 1, 2015
31.151
+2.242
7.75%
jan 1, 2016
30.102
-1.049
-3.37%
Ranking of countries by current statistics by years


Comments: