29
/
en
AIzaSyAYiBZKx7MnpbEhh9jyipgxe19OcubqV5w
April 1, 2024
58178
South Asia (IDA & IBRD)
TSA
false
2
1
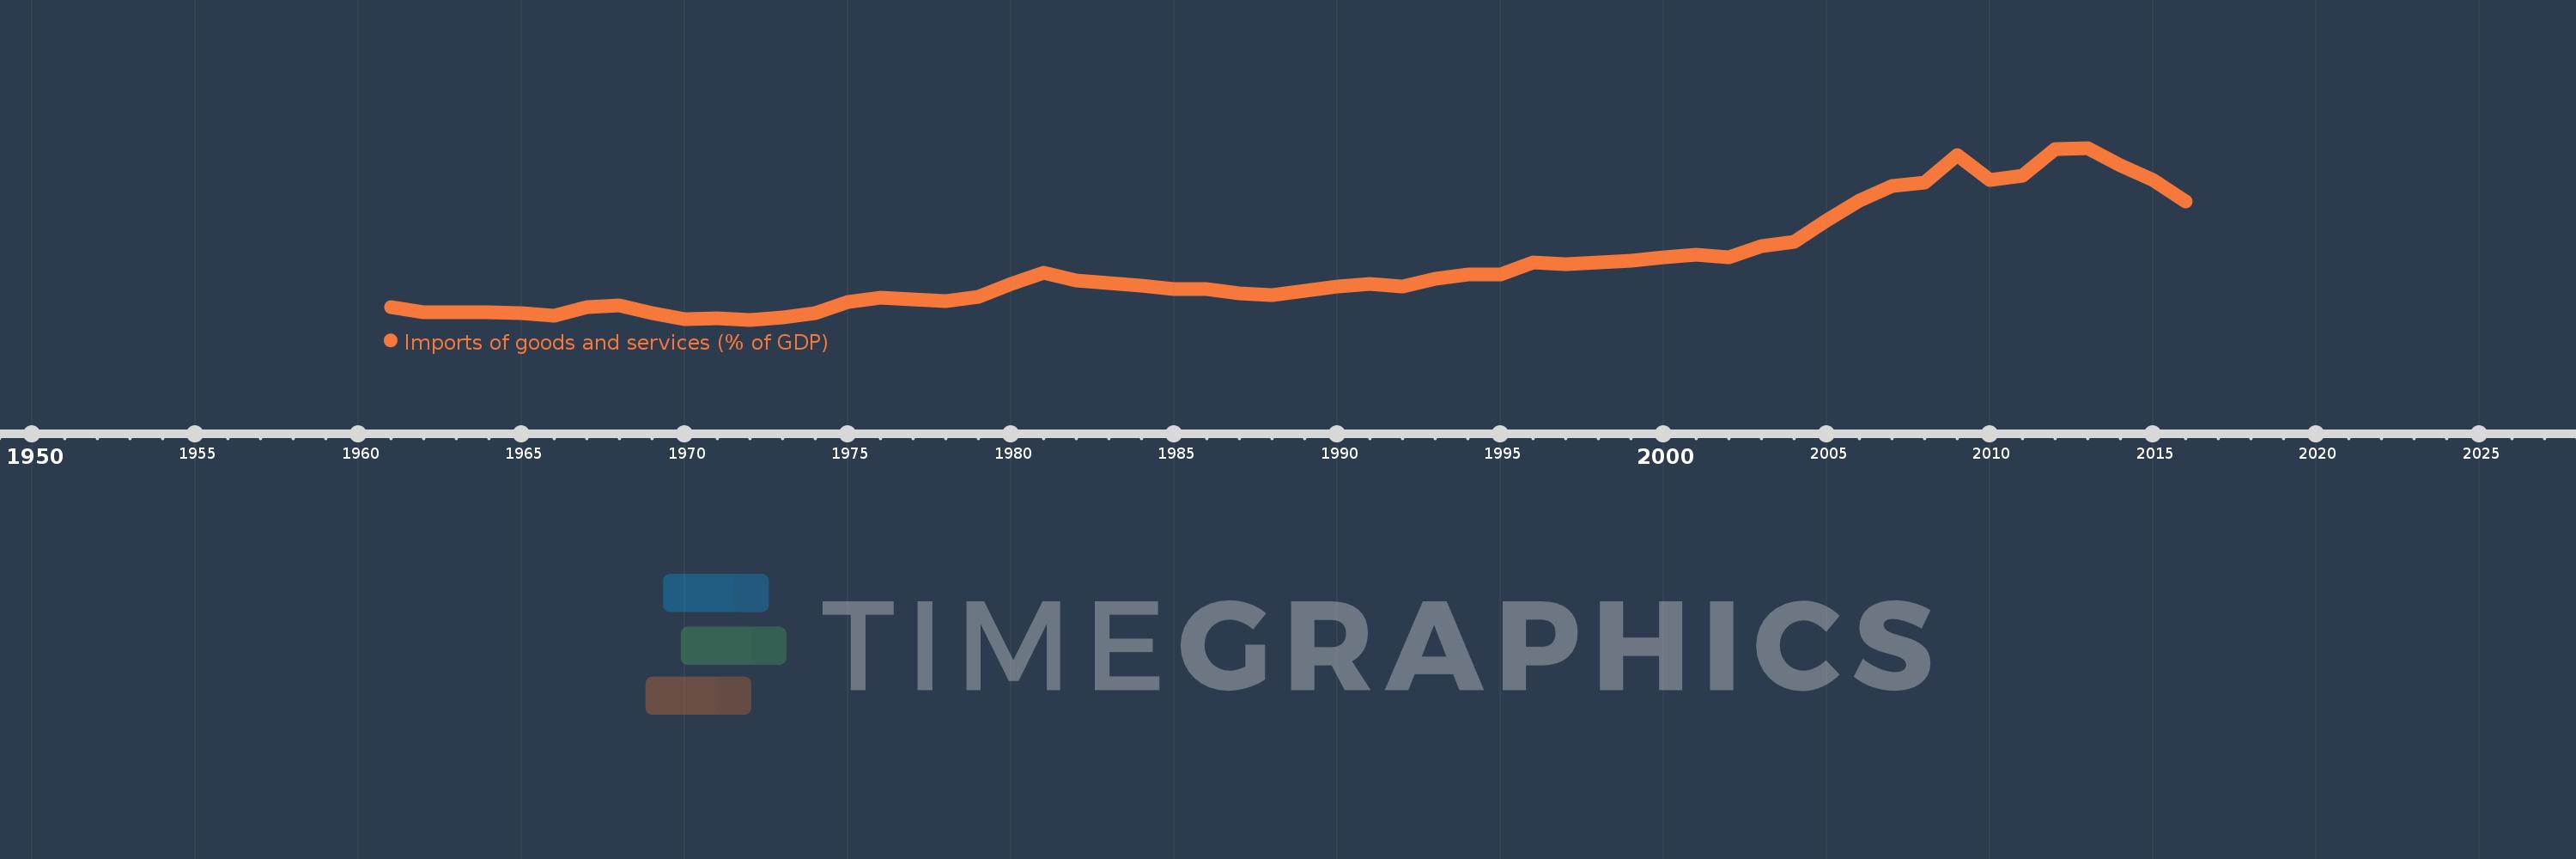
Imports of goods and services (% of GDP)
2016,2015,2014,2013,2012,2011,2010,2009,2008,2007,2006,2005,2004,2003,2002,2001,2000,1999,1998,1997,1996,1995,1994,1993,1992,1991,1990,1989,1988,1987,1986,1985,1984,1983,1982,1981,1980,1979,1978,1977,1976,1975,1974,1973,1972,1971,1970,1969,1968,1967,1966,1965,1964,1963,1962,1961
This statistics in other country:
AfghanistanAlbaniaAlgeriaAngolaAntigua and BarbudaArab WorldArgentinaArmeniaArubaAustraliaAustriaAzerbaijanBahamas, TheBahrainBangladeshBarbadosBelarusBelgiumBelizeBeninBermudaBhutanBoliviaBosnia and HerzegovinaBotswanaBrazilBrunei DarussalamBulgariaBurkina FasoBurundiCabo VerdeCambodiaCameroonCanadaCaribbean small statesCentral African RepublicCentral Europe and the BalticsChadChileChinaColombiaComorosCongo, Dem. Rep.Congo, Rep.Costa RicaCote d'IvoireCroatiaCubaCyprusCzech RepublicDenmarkDjiboutiDominicaDominican RepublicEarly-demographic dividendEast Asia & PacificEast Asia & Pacific (excluding high income)East Asia & Pacific (IDA & IBRD countries)EcuadorEgypt, Arab Rep.El SalvadorEquatorial GuineaEritreaEstoniaEthiopiaEuro areaEurope & Central AsiaEurope & Central Asia (excluding high income)Europe & Central Asia (IDA & IBRD countries)European UnionFaroe IslandsFijiFinlandFragile and conflict affected situationsFranceFrench PolynesiaGabonGambia, TheGeorgiaGermanyGhanaGreeceGrenadaGuatemalaGuineaGuinea-BissauGuyanaHaitiHeavily indebted poor countries (HIPC)High incomeHondurasHong Kong SAR, ChinaHungaryIBRD onlyIcelandIDA & IBRD totalIDA blendIDA onlyIDA totalIndiaIndonesiaIran, Islamic Rep.IraqIrelandIsraelItalyJamaicaJapanJordanKazakhstanKenyaKiribatiKorea, Rep.KosovoKuwaitKyrgyz RepublicLao PDRLate-demographic dividendLatin America & Caribbean Latin America & Caribbean (excluding high income)Latin America & the Caribbean (IDA & IBRD countries)LatviaLeast developed countries: UN classificationLebanonLesothoLiberiaLibyaLithuaniaLow & middle incomeLow incomeLower middle incomeLuxembourgMacao SAR, ChinaMacedonia, FYRMadagascarMalawiMalaysiaMaldivesMaliMaltaMauritaniaMauritiusMexicoMicronesia, Fed. Sts.Middle East & North AfricaMiddle East & North Africa (excluding high income)Middle East & North Africa (IDA & IBRD countries)Middle incomeMoldovaMongoliaMontenegroMoroccoMozambiqueMyanmarNamibiaNepalNetherlandsNew CaledoniaNew ZealandNicaraguaNigerNigeriaNorth AmericaNorwayOECD membersOmanOther small statesPacific island small statesPakistanPalauPanamaPapua New GuineaParaguayPeruPhilippinesPolandPortugalPost-demographic dividendPre-demographic dividendPuerto RicoQatarRomaniaRussian FederationRwandaSamoaSaudi ArabiaSenegalSerbiaSeychellesSierra LeoneSingaporeSlovak RepublicSloveniaSmall statesSolomon IslandsSomaliaSouth AfricaSouth AsiaSouth Asia (IDA & IBRD)South SudanSpainSri LankaSt. Kitts and NevisSt. LuciaSt. Vincent and the GrenadinesSub-Saharan Africa Sub-Saharan Africa (excluding high income)Sub-Saharan Africa (IDA & IBRD countries)SudanSurinameSwazilandSwedenSwitzerlandSyrian Arab RepublicTajikistanTanzaniaThailandTimor-LesteTogoTongaTrinidad and TobagoTunisiaTurkeyTurkmenistanUgandaUkraineUnited Arab EmiratesUnited KingdomUnited StatesUpper middle incomeUruguayUzbekistanVanuatuVenezuela, RBVietnamWest Bank and GazaWorldYemen, Rep.ZambiaZimbabwe Timeline:
This timeline shows a graph from 1961 to 2016 of South Asia (IDA & IBRD). No data until 1960. Number of actual observations by date: 56.
Source name:
World Development Indicators
Source organization:
World Bank national accounts data, and OECD National Accounts data files.
Categories, topics:
Economy & Growth, Trade
Last updated:
apr 23, 2017
Indicators value changes by year
Maximum:
30.174
jan 1, 2013
At the date of observation
Value
Absolute change
Change from previous value
jan 1, 1961
7.631
+7.631
0.0%
jan 1, 1962
6.907
-0.724
-9.48%
jan 1, 1963
6.942
+0.035
0.51%
jan 1, 1964
6.905
-0.038
-0.54%
jan 1, 1965
6.866
-0.039
-0.57%
jan 1, 1966
6.454
-0.412
-6.0%
jan 1, 1967
7.623
+1.169
18.12%
jan 1, 1968
7.934
+0.311
4.08%
jan 1, 1969
6.782
-1.152
-14.52%
jan 1, 1970
6.024
-0.758
-11.18%
jan 1, 1971
6.096
+0.071
1.18%
jan 1, 1972
5.893
-0.203
-3.33%
jan 1, 1973
6.181
+0.288
4.88%
jan 1, 1974
6.838
+0.657
10.63%
jan 1, 1975
8.408
+1.57
22.96%
jan 1, 1976
8.962
+0.555
6.6%
jan 1, 1977
8.758
-0.204
-2.28%
jan 1, 1978
8.492
-0.266
-3.04%
jan 1, 1979
9.123
+0.631
7.44%
jan 1, 1980
10.937
+1.813
19.87%
jan 1, 1981
12.516
+1.58
14.44%
jan 1, 1982
11.454
-1.062
-8.48%
jan 1, 1983
11.054
-0.4
-3.49%
jan 1, 1984
10.756
-0.298
-2.7%
jan 1, 1985
10.276
-0.48
-4.46%
jan 1, 1986
10.264
-0.012
-0.11%
jan 1, 1987
9.624
-0.64
-6.23%
jan 1, 1988
9.433
-0.192
-1.99%
jan 1, 1989
9.958
+0.525
5.56%
jan 1, 1990
10.546
+0.588
5.91%
jan 1, 1991
10.988
+0.443
4.2%
jan 1, 1992
10.548
-0.44
-4.01%
jan 1, 1993
11.702
+1.154
10.94%
jan 1, 1994
12.242
+0.54
4.62%
jan 1, 1995
12.273
+0.03
0.25%
jan 1, 1996
14.013
+1.741
14.18%
jan 1, 1997
13.717
-0.296
-2.11%
jan 1, 1998
13.939
+0.222
1.62%
jan 1, 1999
14.182
+0.243
1.75%
jan 1, 2000
14.701
+0.519
3.66%
jan 1, 2001
15.108
+0.408
2.77%
jan 1, 2002
14.768
-0.34
-2.25%
jan 1, 2003
16.308
+1.54
10.43%
jan 1, 2004
16.879
+0.571
3.5%
jan 1, 2005
19.919
+3.04
18.01%
jan 1, 2006
22.707
+2.788
14.0%
jan 1, 2007
24.752
+2.045
9.0%
jan 1, 2008
25.246
+0.494
2.0%
jan 1, 2009
29.16
+3.914
15.5%
jan 1, 2010
25.658
-3.502
-12.01%
jan 1, 2011
26.313
+0.656
2.56%
jan 1, 2012
30.001
+3.687
14.01%
jan 1, 2013
30.174
+0.173
0.58%
jan 1, 2014
27.753
-2.421
-8.02%
jan 1, 2015
25.608
-2.145
-7.73%
jan 1, 2016
22.666
-2.942
-11.49%
Ranking of countries by current statistics by years


Comments: