29
/
en
AIzaSyAYiBZKx7MnpbEhh9jyipgxe19OcubqV5w
April 1, 2024
248840
Sri Lanka
LKA
true
2
1
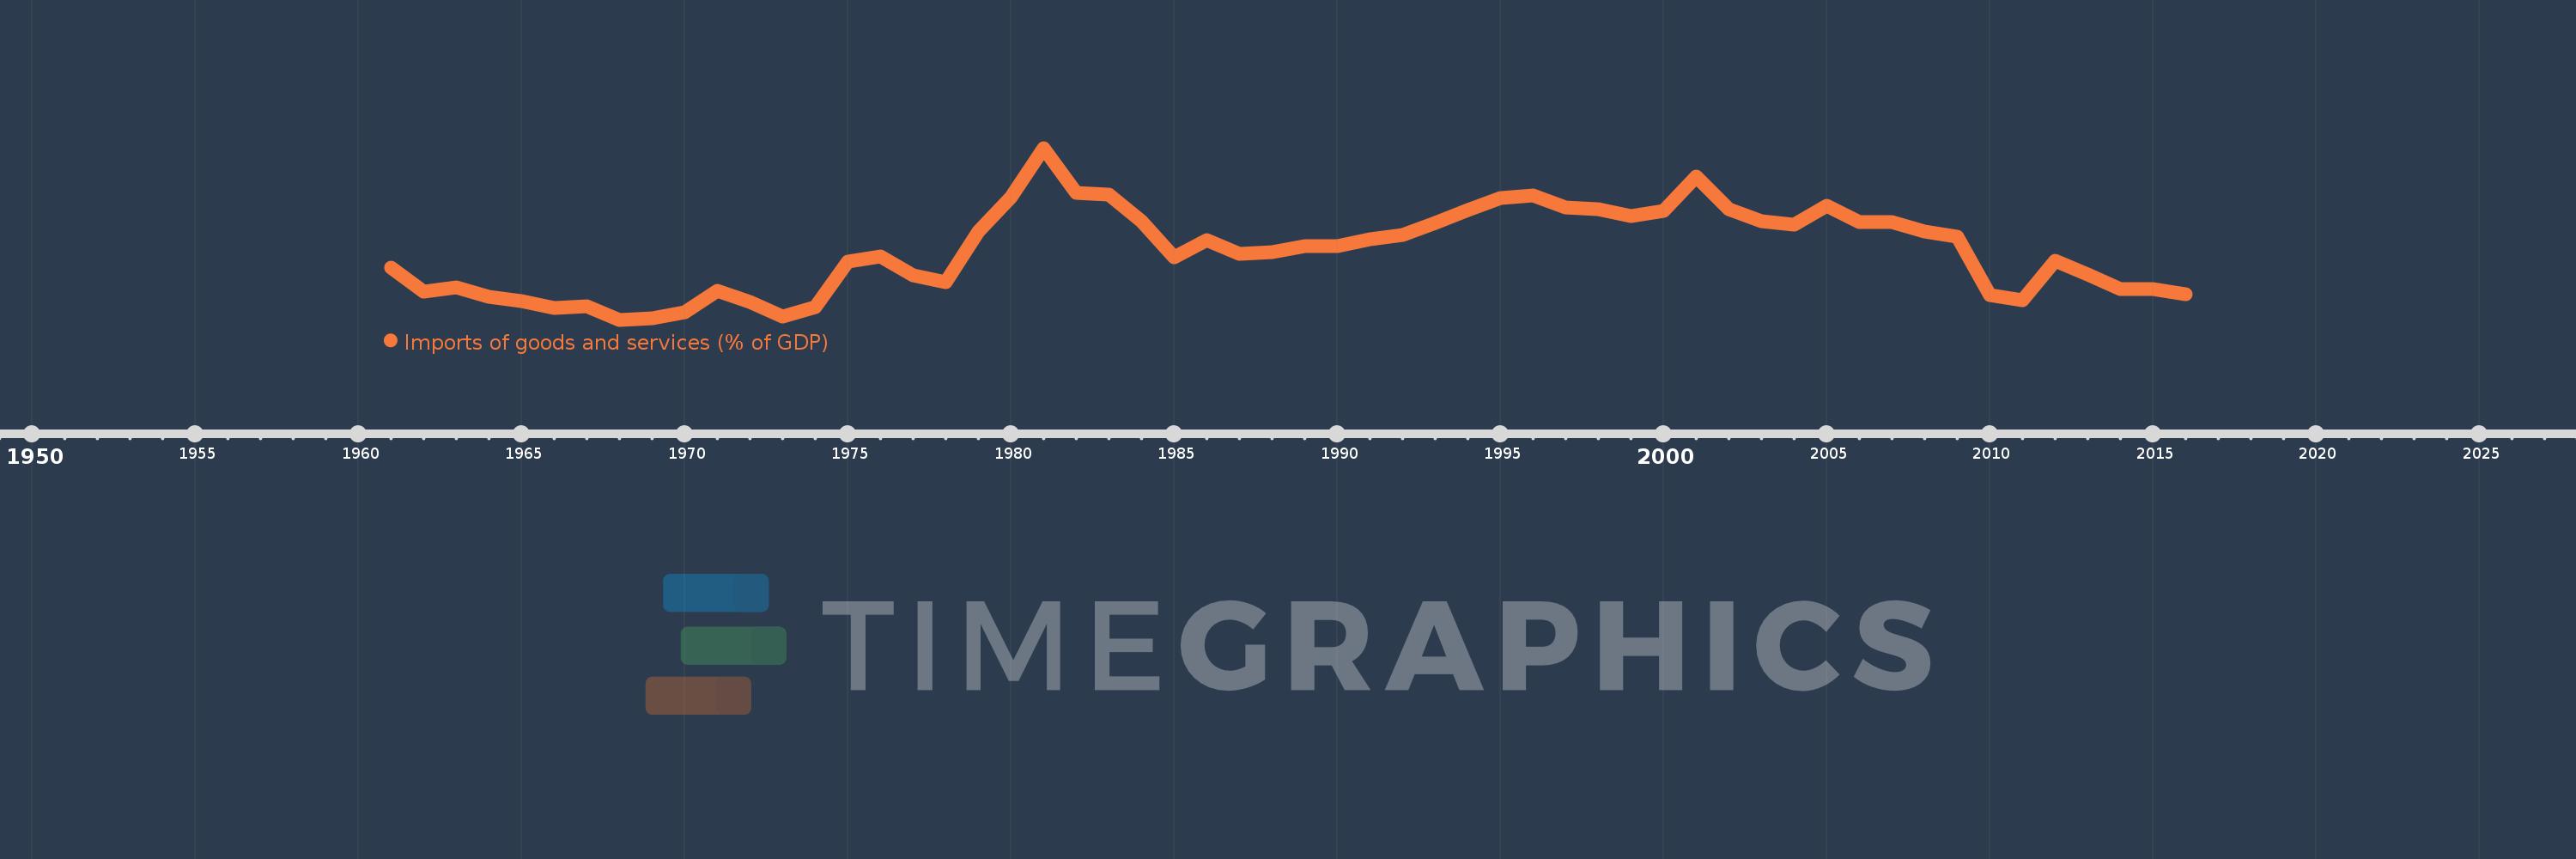
Imports of goods and services (% of GDP)
2016,2015,2014,2013,2012,2011,2010,2009,2008,2007,2006,2005,2004,2003,2002,2001,2000,1999,1998,1997,1996,1995,1994,1993,1992,1991,1990,1989,1988,1987,1986,1985,1984,1983,1982,1981,1980,1979,1978,1977,1976,1975,1974,1973,1972,1971,1970,1969,1968,1967,1966,1965,1964,1963,1962,1961
This statistics in other country:
AfghanistanAlbaniaAlgeriaAngolaAntigua and BarbudaArab WorldArgentinaArmeniaArubaAustraliaAustriaAzerbaijanBahamas, TheBahrainBangladeshBarbadosBelarusBelgiumBelizeBeninBermudaBhutanBoliviaBosnia and HerzegovinaBotswanaBrazilBrunei DarussalamBulgariaBurkina FasoBurundiCabo VerdeCambodiaCameroonCanadaCaribbean small statesCentral African RepublicCentral Europe and the BalticsChadChileChinaColombiaComorosCongo, Dem. Rep.Congo, Rep.Costa RicaCote d'IvoireCroatiaCubaCyprusCzech RepublicDenmarkDjiboutiDominicaDominican RepublicEarly-demographic dividendEast Asia & PacificEast Asia & Pacific (excluding high income)East Asia & Pacific (IDA & IBRD countries)EcuadorEgypt, Arab Rep.El SalvadorEquatorial GuineaEritreaEstoniaEthiopiaEuro areaEurope & Central AsiaEurope & Central Asia (excluding high income)Europe & Central Asia (IDA & IBRD countries)European UnionFaroe IslandsFijiFinlandFragile and conflict affected situationsFranceFrench PolynesiaGabonGambia, TheGeorgiaGermanyGhanaGreeceGrenadaGuatemalaGuineaGuinea-BissauGuyanaHaitiHeavily indebted poor countries (HIPC)High incomeHondurasHong Kong SAR, ChinaHungaryIBRD onlyIcelandIDA & IBRD totalIDA blendIDA onlyIDA totalIndiaIndonesiaIran, Islamic Rep.IraqIrelandIsraelItalyJamaicaJapanJordanKazakhstanKenyaKiribatiKorea, Rep.KosovoKuwaitKyrgyz RepublicLao PDRLate-demographic dividendLatin America & Caribbean Latin America & Caribbean (excluding high income)Latin America & the Caribbean (IDA & IBRD countries)LatviaLeast developed countries: UN classificationLebanonLesothoLiberiaLibyaLithuaniaLow & middle incomeLow incomeLower middle incomeLuxembourgMacao SAR, ChinaMacedonia, FYRMadagascarMalawiMalaysiaMaldivesMaliMaltaMauritaniaMauritiusMexicoMicronesia, Fed. Sts.Middle East & North AfricaMiddle East & North Africa (excluding high income)Middle East & North Africa (IDA & IBRD countries)Middle incomeMoldovaMongoliaMontenegroMoroccoMozambiqueMyanmarNamibiaNepalNetherlandsNew CaledoniaNew ZealandNicaraguaNigerNigeriaNorth AmericaNorwayOECD membersOmanOther small statesPacific island small statesPakistanPalauPanamaPapua New GuineaParaguayPeruPhilippinesPolandPortugalPost-demographic dividendPre-demographic dividendPuerto RicoQatarRomaniaRussian FederationRwandaSamoaSaudi ArabiaSenegalSerbiaSeychellesSierra LeoneSingaporeSlovak RepublicSloveniaSmall statesSolomon IslandsSomaliaSouth AfricaSouth AsiaSouth Asia (IDA & IBRD)South SudanSpainSri LankaSt. Kitts and NevisSt. LuciaSt. Vincent and the GrenadinesSub-Saharan Africa Sub-Saharan Africa (excluding high income)Sub-Saharan Africa (IDA & IBRD countries)SudanSurinameSwazilandSwedenSwitzerlandSyrian Arab RepublicTajikistanTanzaniaThailandTimor-LesteTogoTongaTrinidad and TobagoTunisiaTurkeyTurkmenistanUgandaUkraineUnited Arab EmiratesUnited KingdomUnited StatesUpper middle incomeUruguayUzbekistanVanuatuVenezuela, RBVietnamWest Bank and GazaWorldYemen, Rep.ZambiaZimbabwe Timeline:
This timeline shows a graph from 1961 to 2016 of Sri Lanka. No data until 1960. Number of actual observations by date: 56.
Source name:
World Development Indicators
Source organization:
World Bank national accounts data, and OECD National Accounts data files.
Categories, topics:
Economy & Growth, Trade
Last updated:
apr 23, 2017
Indicators value changes by year
Minimum:
23.304
jan 1, 1968
Maximum:
54.799
jan 1, 1981
At the date of observation
Value
Absolute change
Change from previous value
jan 1, 1961
32.913
+32.913
0.0%
jan 1, 1962
28.485
-4.427
-13.45%
jan 1, 1963
29.201
+0.716
2.51%
jan 1, 1964
27.493
-1.709
-5.85%
jan 1, 1965
26.722
-0.771
-2.8%
jan 1, 1966
25.495
-1.227
-4.59%
jan 1, 1967
25.849
+0.354
1.39%
jan 1, 1968
23.304
-2.544
-9.84%
jan 1, 1969
23.589
+0.284
1.22%
jan 1, 1970
24.617
+1.029
4.36%
jan 1, 1971
28.601
+3.983
16.18%
jan 1, 1972
26.612
-1.989
-6.95%
jan 1, 1973
23.9
-2.712
-10.19%
jan 1, 1974
25.56
+1.66
6.95%
jan 1, 1975
33.898
+8.339
32.62%
jan 1, 1976
34.959
+1.06
3.13%
jan 1, 1977
31.381
-3.578
-10.23%
jan 1, 1978
30.156
-1.225
-3.9%
jan 1, 1979
39.545
+9.389
31.13%
jan 1, 1980
45.754
+6.208
15.7%
jan 1, 1981
54.799
+9.045
19.77%
jan 1, 1982
46.536
-8.263
-15.08%
jan 1, 1983
46.257
-0.279
-0.6%
jan 1, 1984
41.431
-4.826
-10.43%
jan 1, 1985
34.744
-6.688
-16.14%
jan 1, 1986
37.965
+3.222
9.27%
jan 1, 1987
35.329
-2.636
-6.94%
jan 1, 1988
35.696
+0.367
1.04%
jan 1, 1989
36.837
+1.14
3.19%
jan 1, 1990
36.757
-0.08
-0.22%
jan 1, 1991
38.063
+1.306
3.55%
jan 1, 1992
38.855
+0.792
2.08%
jan 1, 1993
41.033
+2.179
5.61%
jan 1, 1994
43.347
+2.313
5.64%
jan 1, 1995
45.618
+2.271
5.24%
jan 1, 1996
46.037
+0.42
0.92%
jan 1, 1997
43.901
-2.137
-4.64%
jan 1, 1998
43.599
-0.301
-0.69%
jan 1, 1999
42.251
-1.348
-3.09%
jan 1, 2000
43.268
+1.017
2.41%
jan 1, 2001
49.621
+6.353
14.68%
jan 1, 2002
43.567
-6.053
-12.2%
jan 1, 2003
41.422
-2.146
-4.92%
jan 1, 2004
40.683
-0.739
-1.78%
jan 1, 2005
44.152
+3.469
8.53%
jan 1, 2006
41.267
-2.885
-6.53%
jan 1, 2007
41.133
-0.134
-0.33%
jan 1, 2008
39.492
-1.641
-3.99%
jan 1, 2009
38.528
-0.964
-2.44%
jan 1, 2010
27.821
-10.707
-27.79%
jan 1, 2011
26.812
-1.009
-3.63%
jan 1, 2012
34.088
+7.276
27.14%
jan 1, 2013
31.676
-2.412
-7.08%
jan 1, 2014
28.937
-2.738
-8.64%
jan 1, 2015
28.918
-0.019
-0.07%
jan 1, 2016
27.952
-0.966
-3.34%
Ranking of countries by current statistics by years


Comments: