29
/
en
AIzaSyAYiBZKx7MnpbEhh9jyipgxe19OcubqV5w
April 1, 2024
108632
Comoros
COM
true
2
1
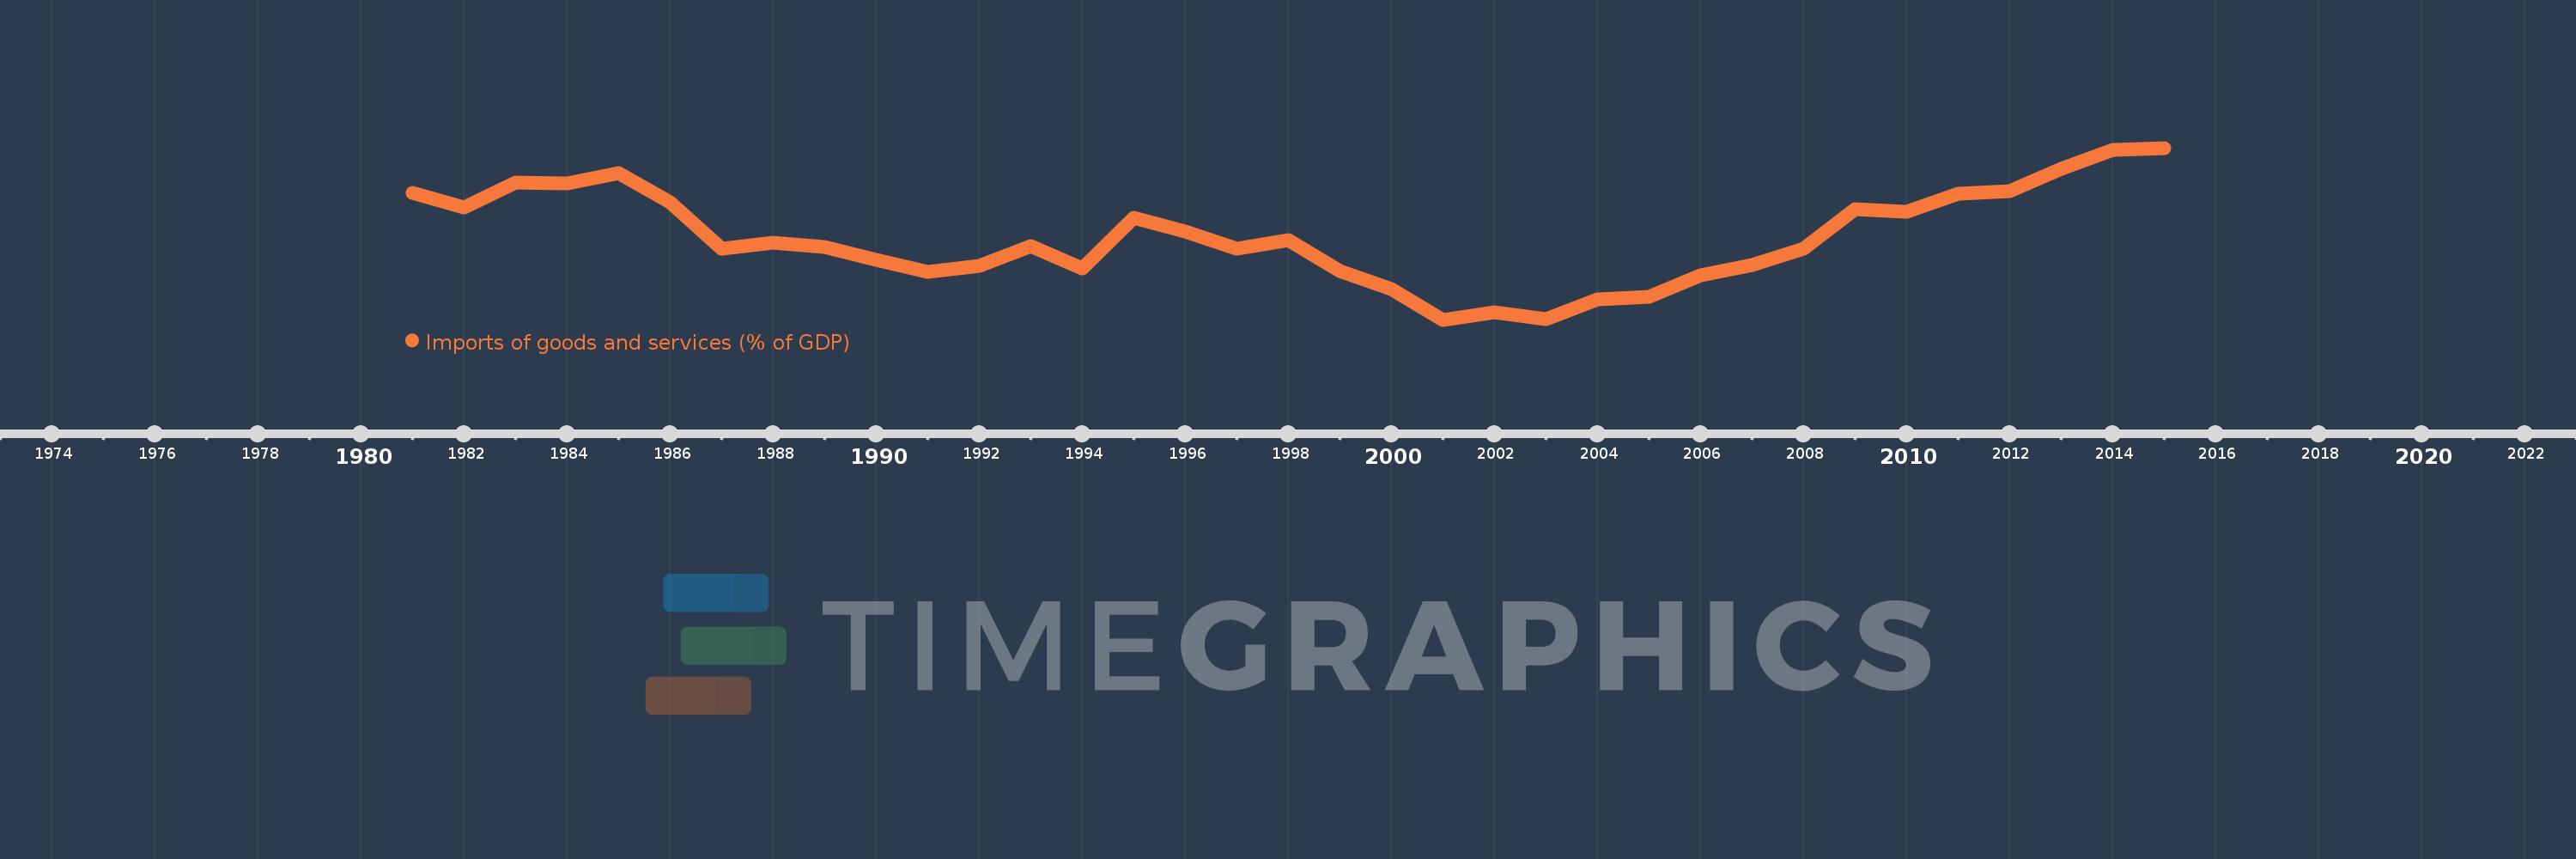
Imports of goods and services (% of GDP)
2015,2014,2013,2012,2011,2010,2009,2008,2007,2006,2005,2004,2003,2002,2001,2000,1999,1998,1997,1996,1995,1994,1993,1992,1991,1990,1989,1988,1987,1986,1985,1984,1983,1982,1981
This statistics in other country:
AfghanistanAlbaniaAlgeriaAngolaAntigua and BarbudaArab WorldArgentinaArmeniaArubaAustraliaAustriaAzerbaijanBahamas, TheBahrainBangladeshBarbadosBelarusBelgiumBelizeBeninBermudaBhutanBoliviaBosnia and HerzegovinaBotswanaBrazilBrunei DarussalamBulgariaBurkina FasoBurundiCabo VerdeCambodiaCameroonCanadaCaribbean small statesCentral African RepublicCentral Europe and the BalticsChadChileChinaColombiaComorosCongo, Dem. Rep.Congo, Rep.Costa RicaCote d'IvoireCroatiaCubaCyprusCzech RepublicDenmarkDjiboutiDominicaDominican RepublicEarly-demographic dividendEast Asia & PacificEast Asia & Pacific (excluding high income)East Asia & Pacific (IDA & IBRD countries)EcuadorEgypt, Arab Rep.El SalvadorEquatorial GuineaEritreaEstoniaEthiopiaEuro areaEurope & Central AsiaEurope & Central Asia (excluding high income)Europe & Central Asia (IDA & IBRD countries)European UnionFaroe IslandsFijiFinlandFragile and conflict affected situationsFranceFrench PolynesiaGabonGambia, TheGeorgiaGermanyGhanaGreeceGrenadaGuatemalaGuineaGuinea-BissauGuyanaHaitiHeavily indebted poor countries (HIPC)High incomeHondurasHong Kong SAR, ChinaHungaryIBRD onlyIcelandIDA & IBRD totalIDA blendIDA onlyIDA totalIndiaIndonesiaIran, Islamic Rep.IraqIrelandIsraelItalyJamaicaJapanJordanKazakhstanKenyaKiribatiKorea, Rep.KosovoKuwaitKyrgyz RepublicLao PDRLate-demographic dividendLatin America & Caribbean Latin America & Caribbean (excluding high income)Latin America & the Caribbean (IDA & IBRD countries)LatviaLeast developed countries: UN classificationLebanonLesothoLiberiaLibyaLithuaniaLow & middle incomeLow incomeLower middle incomeLuxembourgMacao SAR, ChinaMacedonia, FYRMadagascarMalawiMalaysiaMaldivesMaliMaltaMauritaniaMauritiusMexicoMicronesia, Fed. Sts.Middle East & North AfricaMiddle East & North Africa (excluding high income)Middle East & North Africa (IDA & IBRD countries)Middle incomeMoldovaMongoliaMontenegroMoroccoMozambiqueMyanmarNamibiaNepalNetherlandsNew CaledoniaNew ZealandNicaraguaNigerNigeriaNorth AmericaNorwayOECD membersOmanOther small statesPacific island small statesPakistanPalauPanamaPapua New GuineaParaguayPeruPhilippinesPolandPortugalPost-demographic dividendPre-demographic dividendPuerto RicoQatarRomaniaRussian FederationRwandaSamoaSaudi ArabiaSenegalSerbiaSeychellesSierra LeoneSingaporeSlovak RepublicSloveniaSmall statesSolomon IslandsSomaliaSouth AfricaSouth AsiaSouth Asia (IDA & IBRD)South SudanSpainSri LankaSt. Kitts and NevisSt. LuciaSt. Vincent and the GrenadinesSub-Saharan Africa Sub-Saharan Africa (excluding high income)Sub-Saharan Africa (IDA & IBRD countries)SudanSurinameSwazilandSwedenSwitzerlandSyrian Arab RepublicTajikistanTanzaniaThailandTimor-LesteTogoTongaTrinidad and TobagoTunisiaTurkeyTurkmenistanUgandaUkraineUnited Arab EmiratesUnited KingdomUnited StatesUpper middle incomeUruguayUzbekistanVanuatuVenezuela, RBVietnamWest Bank and GazaWorldYemen, Rep.ZambiaZimbabwe Timeline:
This timeline shows a graph from 1981 to 2015 of Comoros. No data until 1980. Number of actual observations by date: 35.
Source name:
World Development Indicators
Source organization:
World Bank national accounts data, and OECD National Accounts data files.
Categories, topics:
Economy & Growth, Trade
Last updated:
apr 23, 2017
Indicators value changes by year
Maximum:
60.299
jan 1, 2015
At the date of observation
Value
Absolute change
Change from previous value
jan 1, 1981
51.943
+51.943
0.0%
jan 1, 1982
49.213
-2.73
-5.26%
jan 1, 1983
53.839
+4.627
9.4%
jan 1, 1984
53.683
-0.156
-0.29%
jan 1, 1985
55.536
+1.853
3.45%
jan 1, 1986
50.058
-5.477
-9.86%
jan 1, 1987
41.493
-8.566
-17.11%
jan 1, 1988
42.5
+1.007
2.43%
jan 1, 1989
41.771
-0.729
-1.72%
jan 1, 1990
39.289
-2.482
-5.94%
jan 1, 1991
37.146
-2.143
-5.45%
jan 1, 1992
38.208
+1.061
2.86%
jan 1, 1993
41.85
+3.643
9.53%
jan 1, 1994
37.712
-4.139
-9.89%
jan 1, 1995
47.248
+9.537
25.29%
jan 1, 1996
44.566
-2.682
-5.68%
jan 1, 1997
41.381
-3.185
-7.15%
jan 1, 1998
43.024
+1.643
3.97%
jan 1, 1999
37.257
-5.767
-13.4%
jan 1, 2000
33.914
-3.343
-8.97%
jan 1, 2001
28.11
-5.803
-17.11%
jan 1, 2002
29.523
+1.413
5.03%
jan 1, 2003
28.164
-1.359
-4.6%
jan 1, 2004
31.868
+3.704
13.15%
jan 1, 2005
32.463
+0.595
1.87%
jan 1, 2006
36.381
+3.917
12.07%
jan 1, 2007
38.331
+1.951
5.36%
jan 1, 2008
41.377
+3.046
7.95%
jan 1, 2009
48.807
+7.43
17.96%
jan 1, 2010
48.386
-0.421
-0.86%
jan 1, 2011
51.679
+3.294
6.81%
jan 1, 2012
52.237
+0.557
1.08%
jan 1, 2013
56.317
+4.081
7.81%
jan 1, 2014
59.852
+3.534
6.28%
jan 1, 2015
60.299
+0.447
0.75%
Ranking of countries by current statistics by years


Comments: