29
/
en
AIzaSyAYiBZKx7MnpbEhh9jyipgxe19OcubqV5w
April 1, 2024
69934
Argentina
ARG
true
2
1
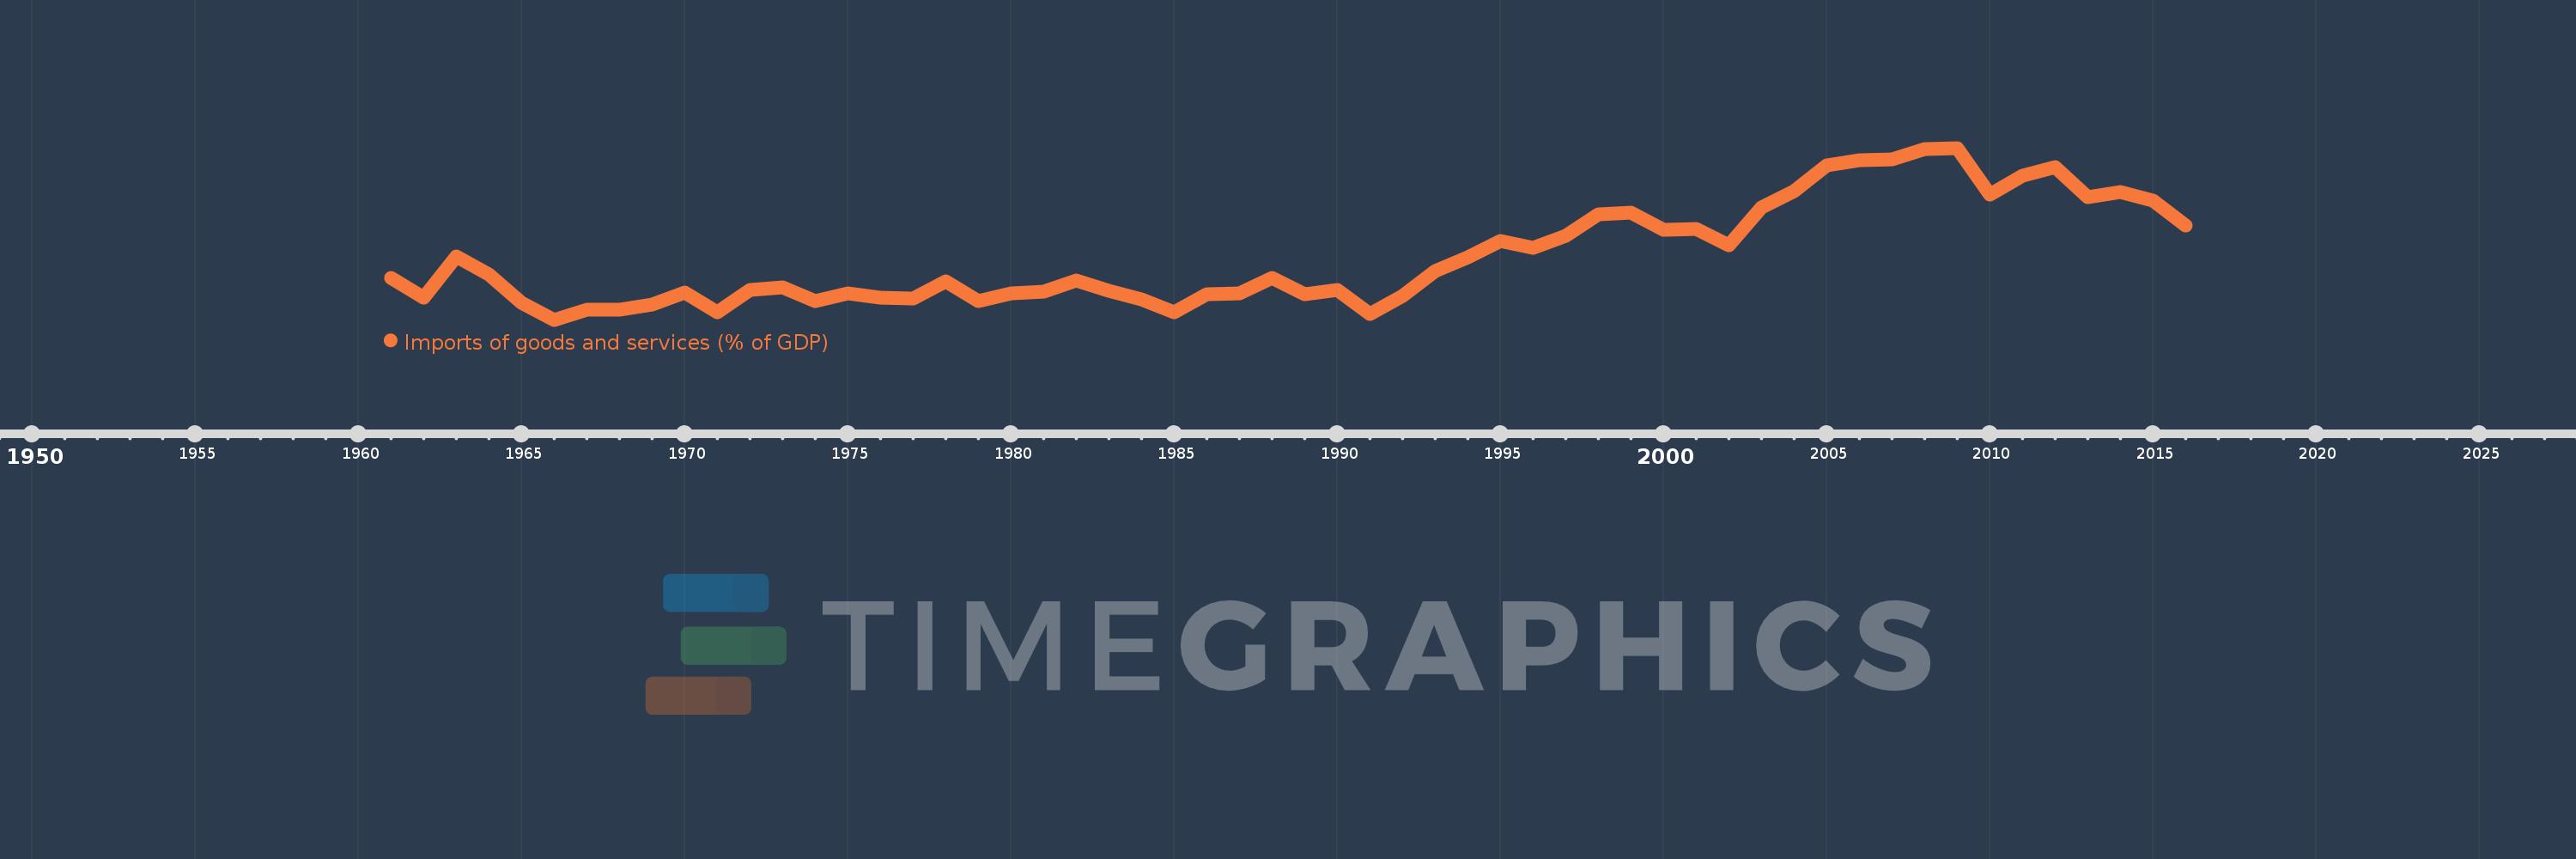
Imports of goods and services (% of GDP)
2016,2015,2014,2013,2012,2011,2010,2009,2008,2007,2006,2005,2004,2003,2002,2001,2000,1999,1998,1997,1996,1995,1994,1993,1992,1991,1990,1989,1988,1987,1986,1985,1984,1983,1982,1981,1980,1979,1978,1977,1976,1975,1974,1973,1972,1971,1970,1969,1968,1967,1966,1965,1964,1963,1962,1961
This statistics in other country:
AfghanistanAlbaniaAlgeriaAngolaAntigua and BarbudaArab WorldArgentinaArmeniaArubaAustraliaAustriaAzerbaijanBahamas, TheBahrainBangladeshBarbadosBelarusBelgiumBelizeBeninBermudaBhutanBoliviaBosnia and HerzegovinaBotswanaBrazilBrunei DarussalamBulgariaBurkina FasoBurundiCabo VerdeCambodiaCameroonCanadaCaribbean small statesCentral African RepublicCentral Europe and the BalticsChadChileChinaColombiaComorosCongo, Dem. Rep.Congo, Rep.Costa RicaCote d'IvoireCroatiaCubaCyprusCzech RepublicDenmarkDjiboutiDominicaDominican RepublicEarly-demographic dividendEast Asia & PacificEast Asia & Pacific (excluding high income)East Asia & Pacific (IDA & IBRD countries)EcuadorEgypt, Arab Rep.El SalvadorEquatorial GuineaEritreaEstoniaEthiopiaEuro areaEurope & Central AsiaEurope & Central Asia (excluding high income)Europe & Central Asia (IDA & IBRD countries)European UnionFaroe IslandsFijiFinlandFragile and conflict affected situationsFranceFrench PolynesiaGabonGambia, TheGeorgiaGermanyGhanaGreeceGrenadaGuatemalaGuineaGuinea-BissauGuyanaHaitiHeavily indebted poor countries (HIPC)High incomeHondurasHong Kong SAR, ChinaHungaryIBRD onlyIcelandIDA & IBRD totalIDA blendIDA onlyIDA totalIndiaIndonesiaIran, Islamic Rep.IraqIrelandIsraelItalyJamaicaJapanJordanKazakhstanKenyaKiribatiKorea, Rep.KosovoKuwaitKyrgyz RepublicLao PDRLate-demographic dividendLatin America & Caribbean Latin America & Caribbean (excluding high income)Latin America & the Caribbean (IDA & IBRD countries)LatviaLeast developed countries: UN classificationLebanonLesothoLiberiaLibyaLithuaniaLow & middle incomeLow incomeLower middle incomeLuxembourgMacao SAR, ChinaMacedonia, FYRMadagascarMalawiMalaysiaMaldivesMaliMaltaMauritaniaMauritiusMexicoMicronesia, Fed. Sts.Middle East & North AfricaMiddle East & North Africa (excluding high income)Middle East & North Africa (IDA & IBRD countries)Middle incomeMoldovaMongoliaMontenegroMoroccoMozambiqueMyanmarNamibiaNepalNetherlandsNew CaledoniaNew ZealandNicaraguaNigerNigeriaNorth AmericaNorwayOECD membersOmanOther small statesPacific island small statesPakistanPalauPanamaPapua New GuineaParaguayPeruPhilippinesPolandPortugalPost-demographic dividendPre-demographic dividendPuerto RicoQatarRomaniaRussian FederationRwandaSamoaSaudi ArabiaSenegalSerbiaSeychellesSierra LeoneSingaporeSlovak RepublicSloveniaSmall statesSolomon IslandsSomaliaSouth AfricaSouth AsiaSouth Asia (IDA & IBRD)South SudanSpainSri LankaSt. Kitts and NevisSt. LuciaSt. Vincent and the GrenadinesSub-Saharan Africa Sub-Saharan Africa (excluding high income)Sub-Saharan Africa (IDA & IBRD countries)SudanSurinameSwazilandSwedenSwitzerlandSyrian Arab RepublicTajikistanTanzaniaThailandTimor-LesteTogoTongaTrinidad and TobagoTunisiaTurkeyTurkmenistanUgandaUkraineUnited Arab EmiratesUnited KingdomUnited StatesUpper middle incomeUruguayUzbekistanVanuatuVenezuela, RBVietnamWest Bank and GazaWorldYemen, Rep.ZambiaZimbabwe Timeline:
This timeline shows a graph from 1961 to 2016 of Argentina. No data until 1960. Number of actual observations by date: 56.
Source name:
World Development Indicators
Source organization:
World Bank national accounts data, and OECD National Accounts data files.
Categories, topics:
Economy & Growth, Trade
Last updated:
apr 23, 2017
Indicators value changes by year
Maximum:
18.262
jan 1, 2009
At the date of observation
Value
Absolute change
Change from previous value
jan 1, 1961
7.604
+7.604
0.0%
jan 1, 1962
5.995
-1.609
-21.16%
jan 1, 1963
9.384
+3.389
56.53%
jan 1, 1964
7.89
-1.493
-15.91%
jan 1, 1965
5.564
-2.327
-29.49%
jan 1, 1966
4.151
-1.413
-25.4%
jan 1, 1967
4.99
+0.839
20.22%
jan 1, 1968
4.997
+0.007
0.15%
jan 1, 1969
5.404
+0.407
8.14%
jan 1, 1970
6.399
+0.995
18.41%
jan 1, 1971
4.736
-1.663
-25.99%
jan 1, 1972
6.608
+1.872
39.53%
jan 1, 1973
6.838
+0.23
3.48%
jan 1, 1974
5.71
-1.128
-16.5%
jan 1, 1975
6.289
+0.58
10.15%
jan 1, 1976
5.979
-0.31
-4.93%
jan 1, 1977
5.921
-0.057
-0.96%
jan 1, 1978
7.326
+1.405
23.73%
jan 1, 1979
5.715
-1.611
-21.99%
jan 1, 1980
6.33
+0.614
10.75%
jan 1, 1981
6.484
+0.154
2.43%
jan 1, 1982
7.372
+0.888
13.7%
jan 1, 1983
6.521
-0.851
-11.54%
jan 1, 1984
5.836
-0.685
-10.5%
jan 1, 1985
4.756
-1.08
-18.5%
jan 1, 1986
6.273
+1.517
31.89%
jan 1, 1987
6.324
+0.051
0.81%
jan 1, 1988
7.576
+1.252
19.79%
jan 1, 1989
6.212
-1.364
-18.0%
jan 1, 1990
6.579
+0.368
5.92%
jan 1, 1991
4.631
-1.948
-29.61%
jan 1, 1992
6.078
+1.447
31.24%
jan 1, 1993
8.133
+2.055
33.81%
jan 1, 1994
9.314
+1.181
14.52%
jan 1, 1995
10.604
+1.291
13.86%
jan 1, 1996
10.091
-0.513
-4.84%
jan 1, 1997
11.078
+0.987
9.78%
jan 1, 1998
12.775
+1.698
15.32%
jan 1, 1999
12.934
+0.159
1.25%
jan 1, 2000
11.555
-1.379
-10.66%
jan 1, 2001
11.636
+0.081
0.7%
jan 1, 2002
10.273
-1.363
-11.71%
jan 1, 2003
13.37
+3.097
30.14%
jan 1, 2004
14.714
+1.344
10.05%
jan 1, 2005
16.845
+2.131
14.48%
jan 1, 2006
17.255
+0.41
2.43%
jan 1, 2007
17.33
+0.075
0.44%
jan 1, 2008
18.2
+0.87
5.02%
jan 1, 2009
18.262
+0.062
0.34%
jan 1, 2010
14.431
-3.831
-20.98%
jan 1, 2011
15.951
+1.52
10.54%
jan 1, 2012
16.662
+0.71
4.45%
jan 1, 2013
14.212
-2.45
-14.7%
jan 1, 2014
14.66
+0.448
3.15%
jan 1, 2015
13.911
-0.749
-5.11%
jan 1, 2016
11.874
-2.037
-14.64%
Ranking of countries by current statistics by years


Comments: