29
/
en
AIzaSyAYiBZKx7MnpbEhh9jyipgxe19OcubqV5w
April 1, 2024
26597
Early-demographic dividend
EAR
false
2
1
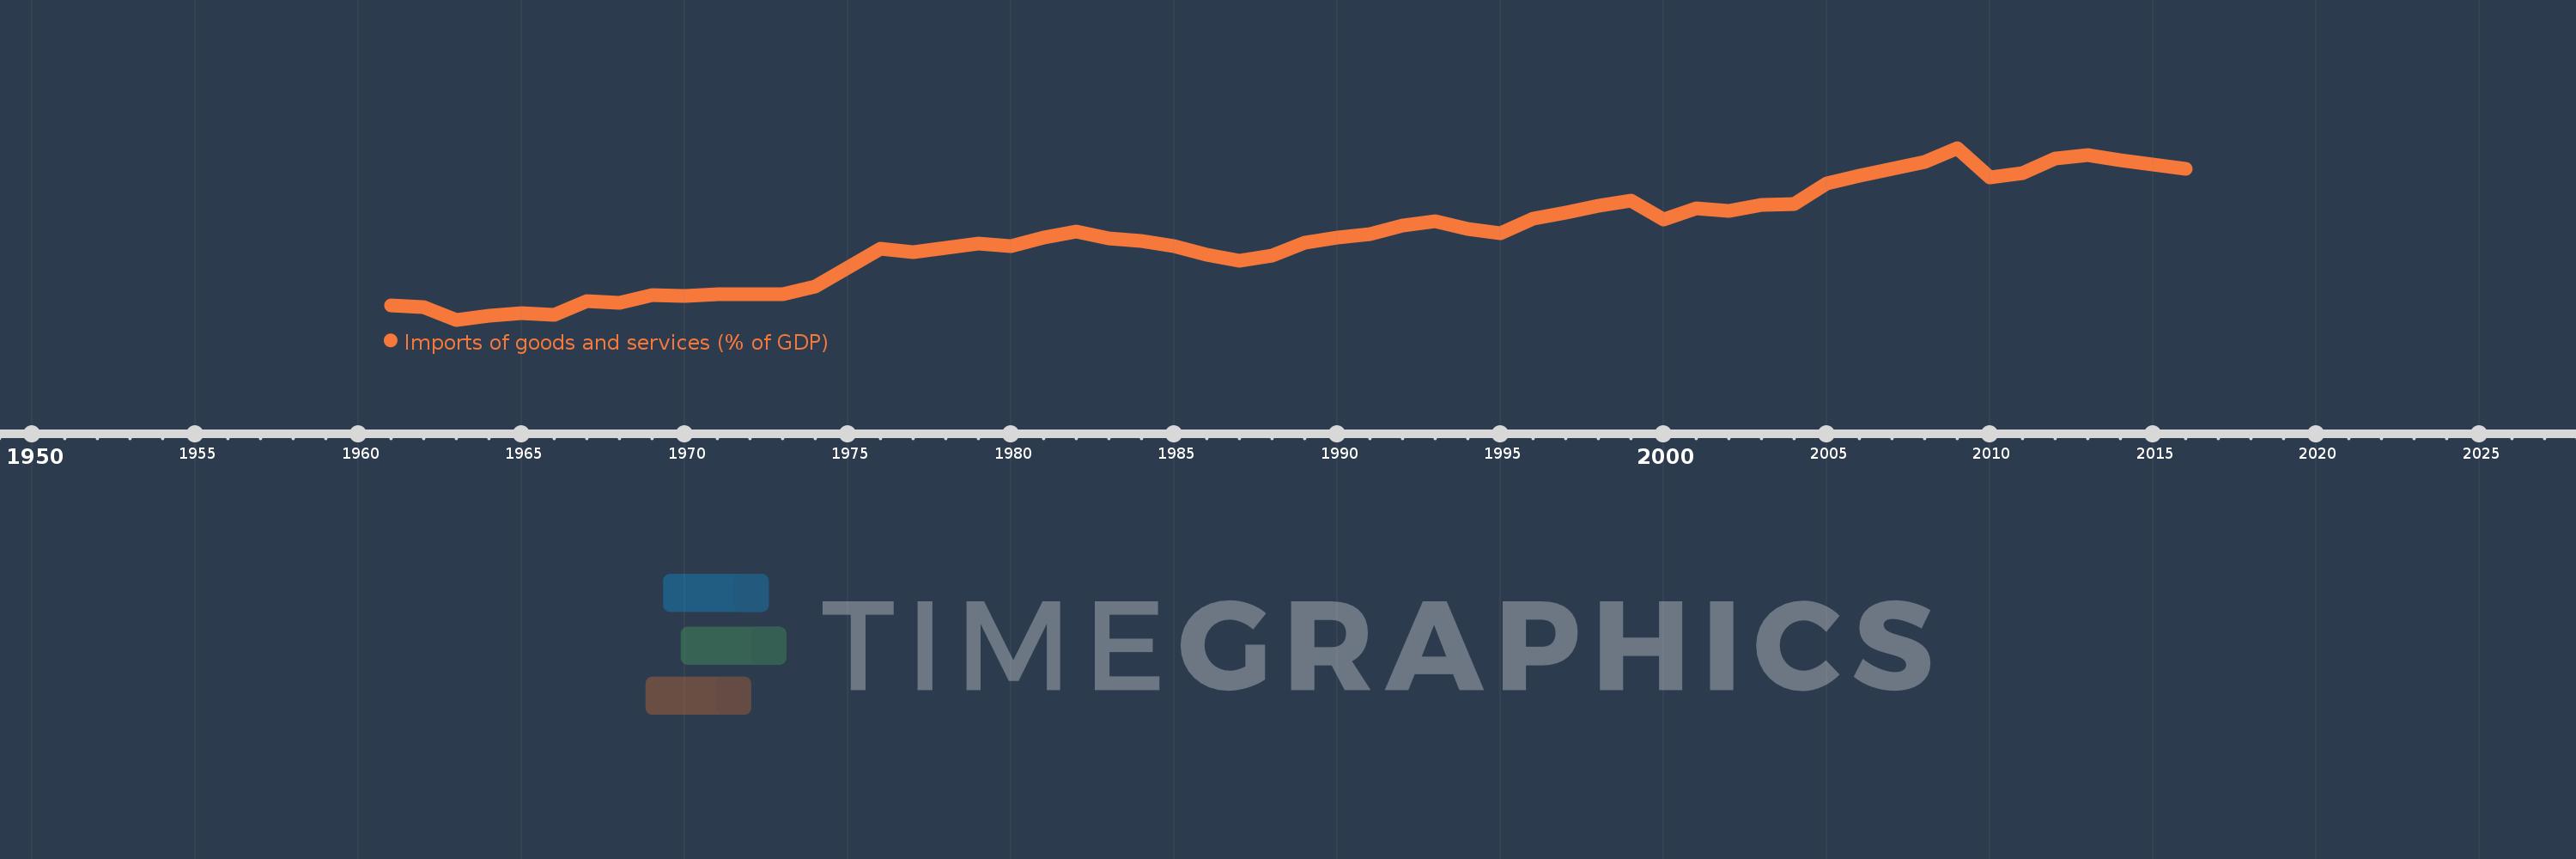
Imports of goods and services (% of GDP)
2016,2015,2014,2013,2012,2011,2010,2009,2008,2007,2006,2005,2004,2003,2002,2001,2000,1999,1998,1997,1996,1995,1994,1993,1992,1991,1990,1989,1988,1987,1986,1985,1984,1983,1982,1981,1980,1979,1978,1977,1976,1975,1974,1973,1972,1971,1970,1969,1968,1967,1966,1965,1964,1963,1962,1961
This statistics in other country:
AfghanistanAlbaniaAlgeriaAngolaAntigua and BarbudaArab WorldArgentinaArmeniaArubaAustraliaAustriaAzerbaijanBahamas, TheBahrainBangladeshBarbadosBelarusBelgiumBelizeBeninBermudaBhutanBoliviaBosnia and HerzegovinaBotswanaBrazilBrunei DarussalamBulgariaBurkina FasoBurundiCabo VerdeCambodiaCameroonCanadaCaribbean small statesCentral African RepublicCentral Europe and the BalticsChadChileChinaColombiaComorosCongo, Dem. Rep.Congo, Rep.Costa RicaCote d'IvoireCroatiaCubaCyprusCzech RepublicDenmarkDjiboutiDominicaDominican RepublicEarly-demographic dividendEast Asia & PacificEast Asia & Pacific (excluding high income)East Asia & Pacific (IDA & IBRD countries)EcuadorEgypt, Arab Rep.El SalvadorEquatorial GuineaEritreaEstoniaEthiopiaEuro areaEurope & Central AsiaEurope & Central Asia (excluding high income)Europe & Central Asia (IDA & IBRD countries)European UnionFaroe IslandsFijiFinlandFragile and conflict affected situationsFranceFrench PolynesiaGabonGambia, TheGeorgiaGermanyGhanaGreeceGrenadaGuatemalaGuineaGuinea-BissauGuyanaHaitiHeavily indebted poor countries (HIPC)High incomeHondurasHong Kong SAR, ChinaHungaryIBRD onlyIcelandIDA & IBRD totalIDA blendIDA onlyIDA totalIndiaIndonesiaIran, Islamic Rep.IraqIrelandIsraelItalyJamaicaJapanJordanKazakhstanKenyaKiribatiKorea, Rep.KosovoKuwaitKyrgyz RepublicLao PDRLate-demographic dividendLatin America & Caribbean Latin America & Caribbean (excluding high income)Latin America & the Caribbean (IDA & IBRD countries)LatviaLeast developed countries: UN classificationLebanonLesothoLiberiaLibyaLithuaniaLow & middle incomeLow incomeLower middle incomeLuxembourgMacao SAR, ChinaMacedonia, FYRMadagascarMalawiMalaysiaMaldivesMaliMaltaMauritaniaMauritiusMexicoMicronesia, Fed. Sts.Middle East & North AfricaMiddle East & North Africa (excluding high income)Middle East & North Africa (IDA & IBRD countries)Middle incomeMoldovaMongoliaMontenegroMoroccoMozambiqueMyanmarNamibiaNepalNetherlandsNew CaledoniaNew ZealandNicaraguaNigerNigeriaNorth AmericaNorwayOECD membersOmanOther small statesPacific island small statesPakistanPalauPanamaPapua New GuineaParaguayPeruPhilippinesPolandPortugalPost-demographic dividendPre-demographic dividendPuerto RicoQatarRomaniaRussian FederationRwandaSamoaSaudi ArabiaSenegalSerbiaSeychellesSierra LeoneSingaporeSlovak RepublicSloveniaSmall statesSolomon IslandsSomaliaSouth AfricaSouth AsiaSouth Asia (IDA & IBRD)South SudanSpainSri LankaSt. Kitts and NevisSt. LuciaSt. Vincent and the GrenadinesSub-Saharan Africa Sub-Saharan Africa (excluding high income)Sub-Saharan Africa (IDA & IBRD countries)SudanSurinameSwazilandSwedenSwitzerlandSyrian Arab RepublicTajikistanTanzaniaThailandTimor-LesteTogoTongaTrinidad and TobagoTunisiaTurkeyTurkmenistanUgandaUkraineUnited Arab EmiratesUnited KingdomUnited StatesUpper middle incomeUruguayUzbekistanVanuatuVenezuela, RBVietnamWest Bank and GazaWorldYemen, Rep.ZambiaZimbabwe Timeline:
This timeline shows a graph from 1961 to 2016 of Early-demographic dividend. No data until 1960. Number of actual observations by date: 56.
Source name:
World Development Indicators
Source organization:
World Bank national accounts data, and OECD National Accounts data files.
Categories, topics:
Economy & Growth, Trade
Last updated:
apr 23, 2017
Indicators value changes by year
Minimum:
11.411
jan 1, 1963
Maximum:
30.415
jan 1, 2009
At the date of observation
Value
Absolute change
Change from previous value
jan 1, 1961
12.961
+12.961
0.0%
jan 1, 1962
12.767
-0.194
-1.5%
jan 1, 1963
11.411
-1.356
-10.62%
jan 1, 1964
11.837
+0.426
3.73%
jan 1, 1965
12.14
+0.303
2.56%
jan 1, 1966
11.986
-0.154
-1.27%
jan 1, 1967
13.47
+1.484
12.38%
jan 1, 1968
13.311
-0.159
-1.18%
jan 1, 1969
14.133
+0.822
6.18%
jan 1, 1970
14.014
-0.119
-0.84%
jan 1, 1971
14.23
+0.216
1.54%
jan 1, 1972
14.277
+0.047
0.33%
jan 1, 1973
14.218
-0.059
-0.42%
jan 1, 1974
15.122
+0.904
6.36%
jan 1, 1975
17.215
+2.093
13.84%
jan 1, 1976
19.253
+2.038
11.84%
jan 1, 1977
18.876
-0.378
-1.96%
jan 1, 1978
19.317
+0.442
2.34%
jan 1, 1979
19.818
+0.501
2.59%
jan 1, 1980
19.578
-0.24
-1.21%
jan 1, 1981
20.506
+0.928
4.74%
jan 1, 1982
21.179
+0.673
3.28%
jan 1, 1983
20.394
-0.785
-3.71%
jan 1, 1984
20.12
-0.274
-1.34%
jan 1, 1985
19.578
-0.543
-2.7%
jan 1, 1986
18.648
-0.93
-4.75%
jan 1, 1987
17.899
-0.749
-4.01%
jan 1, 1988
18.495
+0.596
3.33%
jan 1, 1989
19.912
+1.417
7.66%
jan 1, 1990
20.497
+0.584
2.93%
jan 1, 1991
20.86
+0.363
1.77%
jan 1, 1992
21.799
+0.94
4.5%
jan 1, 1993
22.318
+0.518
2.38%
jan 1, 1994
21.409
-0.909
-4.07%
jan 1, 1995
20.978
-0.431
-2.01%
jan 1, 1996
22.62
+1.642
7.83%
jan 1, 1997
23.288
+0.668
2.95%
jan 1, 1998
24.046
+0.758
3.25%
jan 1, 1999
24.556
+0.51
2.12%
jan 1, 2000
22.489
-2.067
-8.42%
jan 1, 2001
23.737
+1.248
5.55%
jan 1, 2002
23.478
-0.259
-1.09%
jan 1, 2003
24.124
+0.646
2.75%
jan 1, 2004
24.195
+0.071
0.3%
jan 1, 2005
26.459
+2.264
9.36%
jan 1, 2006
27.305
+0.846
3.2%
jan 1, 2007
28.1
+0.795
2.91%
jan 1, 2008
28.866
+0.766
2.73%
jan 1, 2009
30.415
+1.549
5.37%
jan 1, 2010
27.194
-3.221
-10.59%
jan 1, 2011
27.643
+0.449
1.65%
jan 1, 2012
29.247
+1.604
5.8%
jan 1, 2013
29.663
+0.416
1.42%
jan 1, 2014
29.021
-0.642
-2.17%
jan 1, 2015
28.628
-0.393
-1.35%
jan 1, 2016
28.146
-0.482
-1.68%
Ranking of countries by current statistics by years


Comments: