29
/
en
AIzaSyAYiBZKx7MnpbEhh9jyipgxe19OcubqV5w
April 1, 2024
160601
Israel
ISR
true
2
1
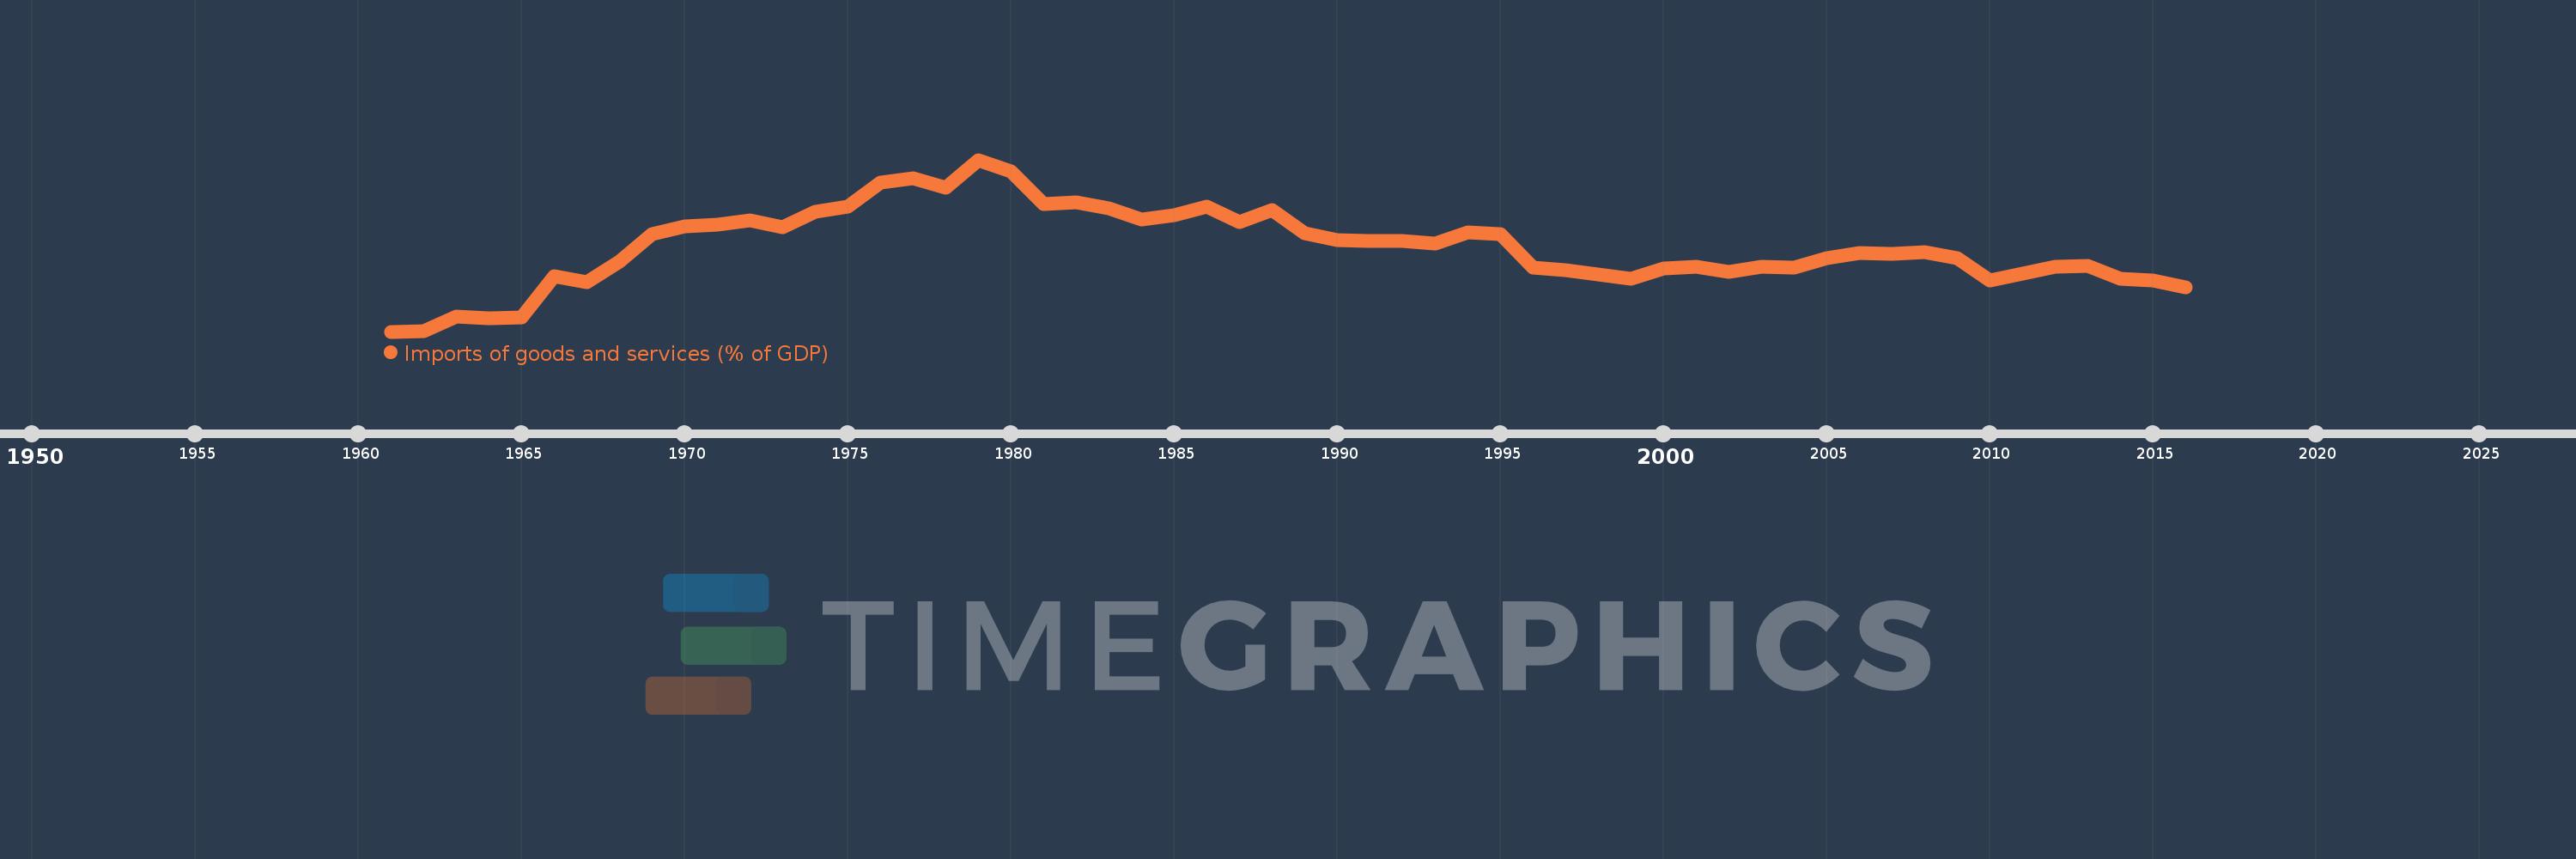
Imports of goods and services (% of GDP)
2016,2015,2014,2013,2012,2011,2010,2009,2008,2007,2006,2005,2004,2003,2002,2001,2000,1999,1998,1997,1996,1995,1994,1993,1992,1991,1990,1989,1988,1987,1986,1985,1984,1983,1982,1981,1980,1979,1978,1977,1976,1975,1974,1973,1972,1971,1970,1969,1968,1967,1966,1965,1964,1963,1962,1961
This statistics in other country:
AfghanistanAlbaniaAlgeriaAngolaAntigua and BarbudaArab WorldArgentinaArmeniaArubaAustraliaAustriaAzerbaijanBahamas, TheBahrainBangladeshBarbadosBelarusBelgiumBelizeBeninBermudaBhutanBoliviaBosnia and HerzegovinaBotswanaBrazilBrunei DarussalamBulgariaBurkina FasoBurundiCabo VerdeCambodiaCameroonCanadaCaribbean small statesCentral African RepublicCentral Europe and the BalticsChadChileChinaColombiaComorosCongo, Dem. Rep.Congo, Rep.Costa RicaCote d'IvoireCroatiaCubaCyprusCzech RepublicDenmarkDjiboutiDominicaDominican RepublicEarly-demographic dividendEast Asia & PacificEast Asia & Pacific (excluding high income)East Asia & Pacific (IDA & IBRD countries)EcuadorEgypt, Arab Rep.El SalvadorEquatorial GuineaEritreaEstoniaEthiopiaEuro areaEurope & Central AsiaEurope & Central Asia (excluding high income)Europe & Central Asia (IDA & IBRD countries)European UnionFaroe IslandsFijiFinlandFragile and conflict affected situationsFranceFrench PolynesiaGabonGambia, TheGeorgiaGermanyGhanaGreeceGrenadaGuatemalaGuineaGuinea-BissauGuyanaHaitiHeavily indebted poor countries (HIPC)High incomeHondurasHong Kong SAR, ChinaHungaryIBRD onlyIcelandIDA & IBRD totalIDA blendIDA onlyIDA totalIndiaIndonesiaIran, Islamic Rep.IraqIrelandIsraelItalyJamaicaJapanJordanKazakhstanKenyaKiribatiKorea, Rep.KosovoKuwaitKyrgyz RepublicLao PDRLate-demographic dividendLatin America & Caribbean Latin America & Caribbean (excluding high income)Latin America & the Caribbean (IDA & IBRD countries)LatviaLeast developed countries: UN classificationLebanonLesothoLiberiaLibyaLithuaniaLow & middle incomeLow incomeLower middle incomeLuxembourgMacao SAR, ChinaMacedonia, FYRMadagascarMalawiMalaysiaMaldivesMaliMaltaMauritaniaMauritiusMexicoMicronesia, Fed. Sts.Middle East & North AfricaMiddle East & North Africa (excluding high income)Middle East & North Africa (IDA & IBRD countries)Middle incomeMoldovaMongoliaMontenegroMoroccoMozambiqueMyanmarNamibiaNepalNetherlandsNew CaledoniaNew ZealandNicaraguaNigerNigeriaNorth AmericaNorwayOECD membersOmanOther small statesPacific island small statesPakistanPalauPanamaPapua New GuineaParaguayPeruPhilippinesPolandPortugalPost-demographic dividendPre-demographic dividendPuerto RicoQatarRomaniaRussian FederationRwandaSamoaSaudi ArabiaSenegalSerbiaSeychellesSierra LeoneSingaporeSlovak RepublicSloveniaSmall statesSolomon IslandsSomaliaSouth AfricaSouth AsiaSouth Asia (IDA & IBRD)South SudanSpainSri LankaSt. Kitts and NevisSt. LuciaSt. Vincent and the GrenadinesSub-Saharan Africa Sub-Saharan Africa (excluding high income)Sub-Saharan Africa (IDA & IBRD countries)SudanSurinameSwazilandSwedenSwitzerlandSyrian Arab RepublicTajikistanTanzaniaThailandTimor-LesteTogoTongaTrinidad and TobagoTunisiaTurkeyTurkmenistanUgandaUkraineUnited Arab EmiratesUnited KingdomUnited StatesUpper middle incomeUruguayUzbekistanVanuatuVenezuela, RBVietnamWest Bank and GazaWorldYemen, Rep.ZambiaZimbabwe Timeline:
This timeline shows a graph from 1961 to 2016 of Israel. No data until 1960. Number of actual observations by date: 56.
Source name:
World Development Indicators
Source organization:
World Bank national accounts data, and OECD National Accounts data files.
Categories, topics:
Economy & Growth, Trade
Last updated:
apr 23, 2017
Indicators value changes by year
Minimum:
11.122
jan 1, 1961
Maximum:
76.003
jan 1, 1979
At the date of observation
Value
Absolute change
Change from previous value
jan 1, 1961
11.122
+11.122
0.0%
jan 1, 1962
11.216
+0.094
0.84%
jan 1, 1963
16.733
+5.518
49.2%
jan 1, 1964
16.008
-0.725
-4.34%
jan 1, 1965
16.376
+0.369
2.3%
jan 1, 1966
31.92
+15.544
94.92%
jan 1, 1967
29.673
-2.247
-7.04%
jan 1, 1968
37.428
+7.754
26.13%
jan 1, 1969
47.839
+10.411
27.82%
jan 1, 1970
50.888
+3.05
6.37%
jan 1, 1971
51.572
+0.683
1.34%
jan 1, 1972
53.138
+1.566
3.04%
jan 1, 1973
50.422
-2.716
-5.11%
jan 1, 1974
56.276
+5.854
11.61%
jan 1, 1975
58.343
+2.067
3.67%
jan 1, 1976
67.316
+8.973
15.38%
jan 1, 1977
68.933
+1.617
2.4%
jan 1, 1978
65.539
-3.394
-4.92%
jan 1, 1979
76.003
+10.465
15.97%
jan 1, 1980
71.506
-4.497
-5.92%
jan 1, 1981
59.336
-12.17
-17.02%
jan 1, 1982
59.964
+0.628
1.06%
jan 1, 1983
57.687
-2.277
-3.8%
jan 1, 1984
53.411
-4.276
-7.41%
jan 1, 1985
55.134
+1.722
3.22%
jan 1, 1986
58.269
+3.136
5.69%
jan 1, 1987
52.355
-5.915
-10.15%
jan 1, 1988
57.099
+4.744
9.06%
jan 1, 1989
48.16
-8.939
-15.66%
jan 1, 1990
45.721
-2.439
-5.06%
jan 1, 1991
45.384
-0.337
-0.74%
jan 1, 1992
45.369
-0.014
-0.03%
jan 1, 1993
44.337
-1.033
-2.28%
jan 1, 1994
48.566
+4.23
9.54%
jan 1, 1995
47.965
-0.602
-1.24%
jan 1, 1996
35.379
-12.586
-26.24%
jan 1, 1997
34.256
-1.123
-3.17%
jan 1, 1998
32.587
-1.669
-4.87%
jan 1, 1999
31.165
-1.423
-4.37%
jan 1, 2000
35.087
+3.923
12.59%
jan 1, 2001
35.571
+0.484
1.38%
jan 1, 2002
33.587
-1.984
-5.58%
jan 1, 2003
35.697
+2.11
6.28%
jan 1, 2004
35.355
-0.342
-0.96%
jan 1, 2005
38.96
+3.605
10.2%
jan 1, 2006
40.706
+1.746
4.48%
jan 1, 2007
40.37
-0.336
-0.83%
jan 1, 2008
41.07
+0.7
1.73%
jan 1, 2009
38.825
-2.245
-5.47%
jan 1, 2010
30.446
-8.379
-21.58%
jan 1, 2011
32.89
+2.443
8.03%
jan 1, 2012
35.549
+2.659
8.09%
jan 1, 2013
35.907
+0.358
1.01%
jan 1, 2014
31.13
-4.778
-13.31%
jan 1, 2015
30.39
-0.739
-2.38%
jan 1, 2016
27.707
-2.683
-8.83%
Ranking of countries by current statistics by years


Comments: