29
/
en
AIzaSyAYiBZKx7MnpbEhh9jyipgxe19OcubqV5w
April 1, 2024
262370
Thailand
THA
true
2
1
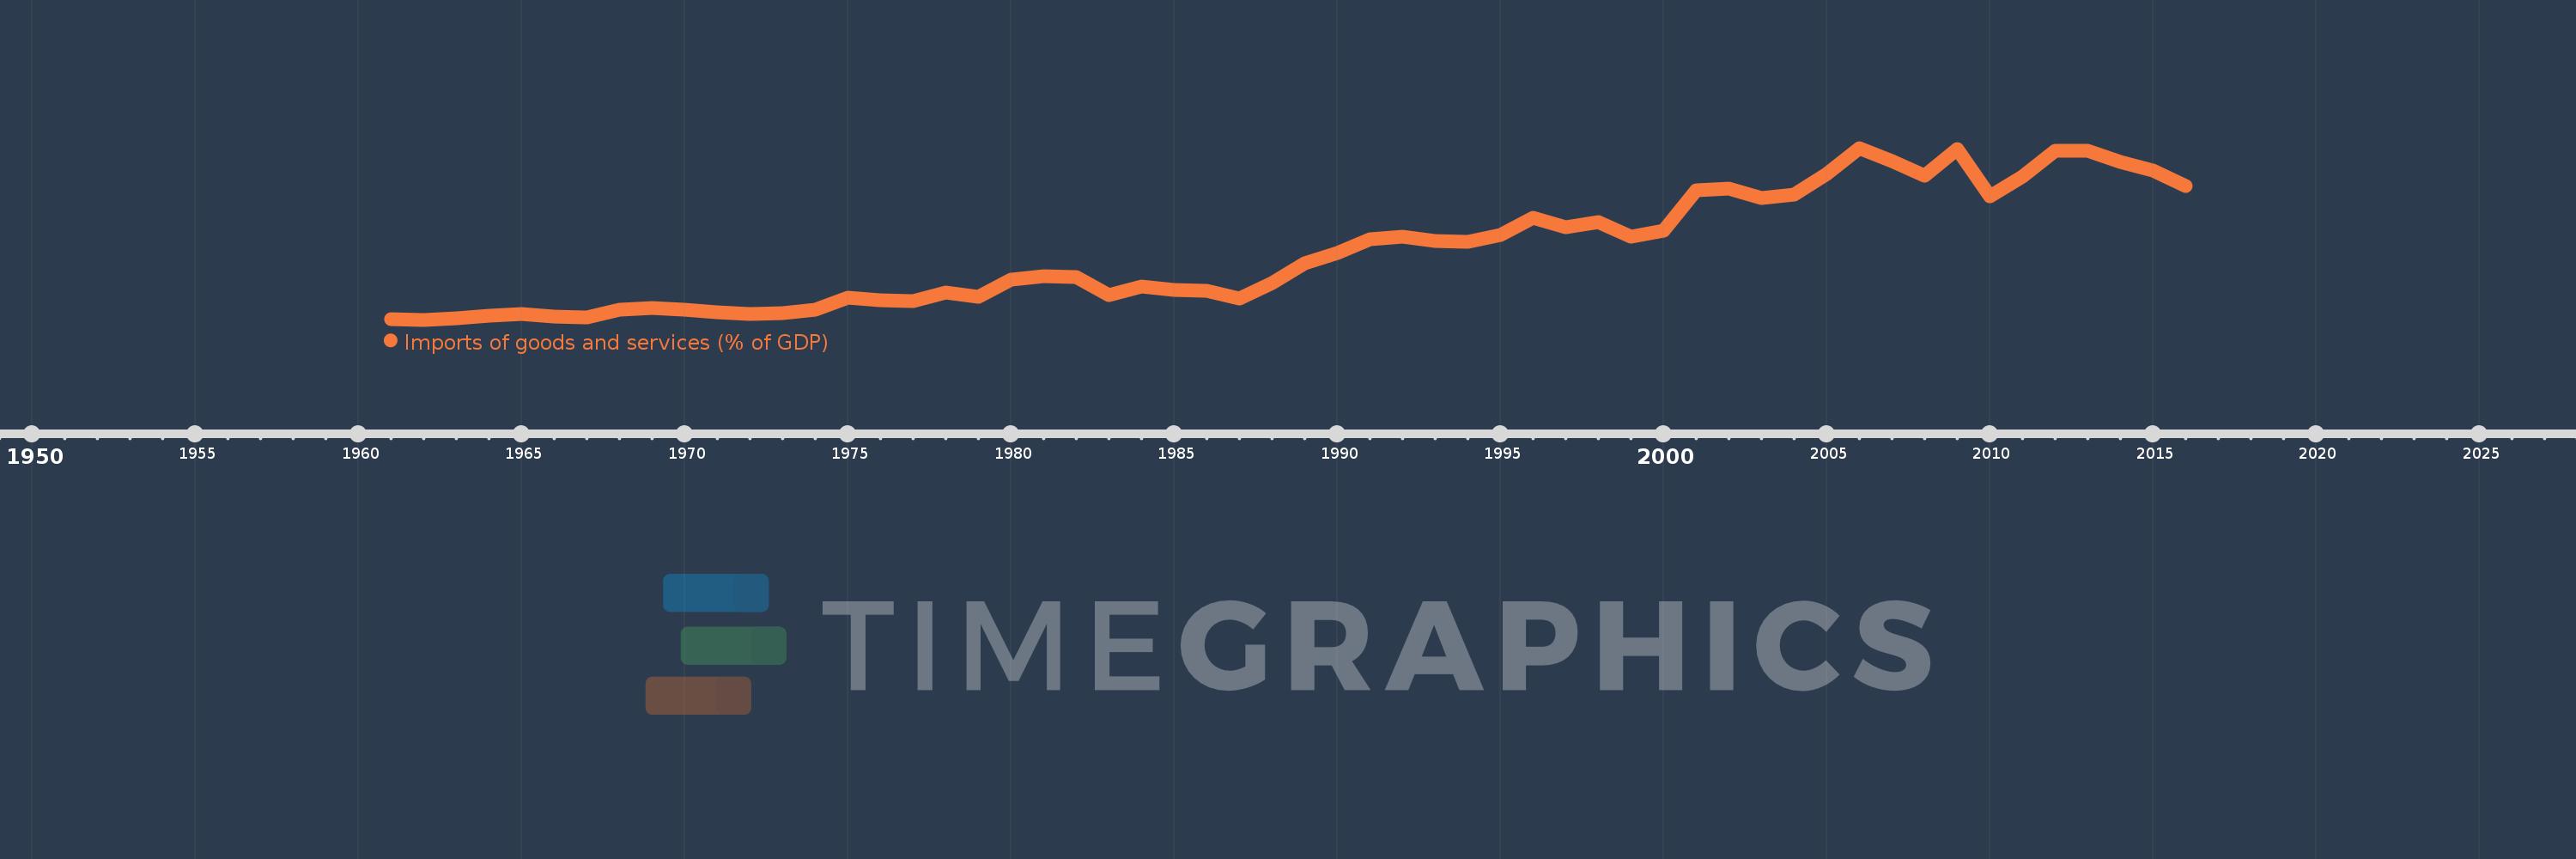
Imports of goods and services (% of GDP)
2016,2015,2014,2013,2012,2011,2010,2009,2008,2007,2006,2005,2004,2003,2002,2001,2000,1999,1998,1997,1996,1995,1994,1993,1992,1991,1990,1989,1988,1987,1986,1985,1984,1983,1982,1981,1980,1979,1978,1977,1976,1975,1974,1973,1972,1971,1970,1969,1968,1967,1966,1965,1964,1963,1962,1961
This statistics in other country:
AfghanistanAlbaniaAlgeriaAngolaAntigua and BarbudaArab WorldArgentinaArmeniaArubaAustraliaAustriaAzerbaijanBahamas, TheBahrainBangladeshBarbadosBelarusBelgiumBelizeBeninBermudaBhutanBoliviaBosnia and HerzegovinaBotswanaBrazilBrunei DarussalamBulgariaBurkina FasoBurundiCabo VerdeCambodiaCameroonCanadaCaribbean small statesCentral African RepublicCentral Europe and the BalticsChadChileChinaColombiaComorosCongo, Dem. Rep.Congo, Rep.Costa RicaCote d'IvoireCroatiaCubaCyprusCzech RepublicDenmarkDjiboutiDominicaDominican RepublicEarly-demographic dividendEast Asia & PacificEast Asia & Pacific (excluding high income)East Asia & Pacific (IDA & IBRD countries)EcuadorEgypt, Arab Rep.El SalvadorEquatorial GuineaEritreaEstoniaEthiopiaEuro areaEurope & Central AsiaEurope & Central Asia (excluding high income)Europe & Central Asia (IDA & IBRD countries)European UnionFaroe IslandsFijiFinlandFragile and conflict affected situationsFranceFrench PolynesiaGabonGambia, TheGeorgiaGermanyGhanaGreeceGrenadaGuatemalaGuineaGuinea-BissauGuyanaHaitiHeavily indebted poor countries (HIPC)High incomeHondurasHong Kong SAR, ChinaHungaryIBRD onlyIcelandIDA & IBRD totalIDA blendIDA onlyIDA totalIndiaIndonesiaIran, Islamic Rep.IraqIrelandIsraelItalyJamaicaJapanJordanKazakhstanKenyaKiribatiKorea, Rep.KosovoKuwaitKyrgyz RepublicLao PDRLate-demographic dividendLatin America & Caribbean Latin America & Caribbean (excluding high income)Latin America & the Caribbean (IDA & IBRD countries)LatviaLeast developed countries: UN classificationLebanonLesothoLiberiaLibyaLithuaniaLow & middle incomeLow incomeLower middle incomeLuxembourgMacao SAR, ChinaMacedonia, FYRMadagascarMalawiMalaysiaMaldivesMaliMaltaMauritaniaMauritiusMexicoMicronesia, Fed. Sts.Middle East & North AfricaMiddle East & North Africa (excluding high income)Middle East & North Africa (IDA & IBRD countries)Middle incomeMoldovaMongoliaMontenegroMoroccoMozambiqueMyanmarNamibiaNepalNetherlandsNew CaledoniaNew ZealandNicaraguaNigerNigeriaNorth AmericaNorwayOECD membersOmanOther small statesPacific island small statesPakistanPalauPanamaPapua New GuineaParaguayPeruPhilippinesPolandPortugalPost-demographic dividendPre-demographic dividendPuerto RicoQatarRomaniaRussian FederationRwandaSamoaSaudi ArabiaSenegalSerbiaSeychellesSierra LeoneSingaporeSlovak RepublicSloveniaSmall statesSolomon IslandsSomaliaSouth AfricaSouth AsiaSouth Asia (IDA & IBRD)South SudanSpainSri LankaSt. Kitts and NevisSt. LuciaSt. Vincent and the GrenadinesSub-Saharan Africa Sub-Saharan Africa (excluding high income)Sub-Saharan Africa (IDA & IBRD countries)SudanSurinameSwazilandSwedenSwitzerlandSyrian Arab RepublicTajikistanTanzaniaThailandTimor-LesteTogoTongaTrinidad and TobagoTunisiaTurkeyTurkmenistanUgandaUkraineUnited Arab EmiratesUnited KingdomUnited StatesUpper middle incomeUruguayUzbekistanVanuatuVenezuela, RBVietnamWest Bank and GazaWorldYemen, Rep.ZambiaZimbabwe Timeline:
This timeline shows a graph from 1961 to 2016 of Thailand. No data until 1960. Number of actual observations by date: 56.
Source name:
World Development Indicators
Source organization:
World Bank national accounts data, and OECD National Accounts data files.
Categories, topics:
Economy & Growth, Trade
Last updated:
apr 23, 2017
Indicators value changes by year
Maximum:
69.451
jan 1, 2006
At the date of observation
Value
Absolute change
Change from previous value
jan 1, 1961
17.415
+17.415
0.0%
jan 1, 1962
17.11
-0.305
-1.75%
jan 1, 1963
17.649
+0.539
3.15%
jan 1, 1964
18.375
+0.726
4.11%
jan 1, 1965
18.775
+0.4
2.18%
jan 1, 1966
18.061
-0.714
-3.8%
jan 1, 1967
17.946
-0.115
-0.64%
jan 1, 1968
20.211
+2.266
12.62%
jan 1, 1969
20.682
+0.47
2.33%
jan 1, 1970
20.061
-0.621
-3.0%
jan 1, 1971
19.382
-0.679
-3.38%
jan 1, 1972
18.813
-0.569
-2.94%
jan 1, 1973
19.184
+0.371
1.97%
jan 1, 1974
20.046
+0.862
4.5%
jan 1, 1975
23.956
+3.909
19.5%
jan 1, 1976
22.975
-0.981
-4.09%
jan 1, 1977
22.705
-0.27
-1.17%
jan 1, 1978
25.378
+2.673
11.77%
jan 1, 1979
24.113
-1.264
-4.98%
jan 1, 1980
29.297
+5.184
21.5%
jan 1, 1981
30.368
+1.071
3.65%
jan 1, 1982
30.121
-0.246
-0.81%
jan 1, 1983
24.63
-5.491
-18.23%
jan 1, 1984
27.273
+2.643
10.73%
jan 1, 1985
26.168
-1.105
-4.05%
jan 1, 1986
25.942
-0.226
-0.86%
jan 1, 1987
23.569
-2.373
-9.15%
jan 1, 1988
28.334
+4.765
20.22%
jan 1, 1989
34.402
+6.068
21.41%
jan 1, 1990
37.485
+3.084
8.96%
jan 1, 1991
41.65
+4.165
11.11%
jan 1, 1992
42.507
+0.856
2.06%
jan 1, 1993
40.982
-1.525
-3.59%
jan 1, 1994
40.929
-0.054
-0.13%
jan 1, 1995
43.007
+2.078
5.08%
jan 1, 1996
48.224
+5.217
12.13%
jan 1, 1997
45.256
-2.968
-6.15%
jan 1, 1998
46.815
+1.559
3.45%
jan 1, 1999
42.303
-4.512
-9.64%
jan 1, 2000
44.268
+1.965
4.64%
jan 1, 2001
56.458
+12.19
27.54%
jan 1, 2002
57.017
+0.559
0.99%
jan 1, 2003
54.324
-2.693
-4.72%
jan 1, 2004
55.17
+0.846
1.56%
jan 1, 2005
61.44
+6.27
11.36%
jan 1, 2006
69.451
+8.011
13.04%
jan 1, 2007
65.412
-4.04
-5.82%
jan 1, 2008
61.001
-4.411
-6.74%
jan 1, 2009
69.021
+8.02
13.15%
jan 1, 2010
54.758
-14.262
-20.66%
jan 1, 2011
60.609
+5.851
10.69%
jan 1, 2012
68.578
+7.968
13.15%
jan 1, 2013
68.462
-0.116
-0.17%
jan 1, 2014
65.083
-3.379
-4.94%
jan 1, 2015
62.671
-2.412
-3.71%
jan 1, 2016
57.742
-4.929
-7.86%
Ranking of countries by current statistics by years


Comments: