29
/
en
AIzaSyAYiBZKx7MnpbEhh9jyipgxe19OcubqV5w
April 1, 2024
73088
Australia
AUS
true
2
1
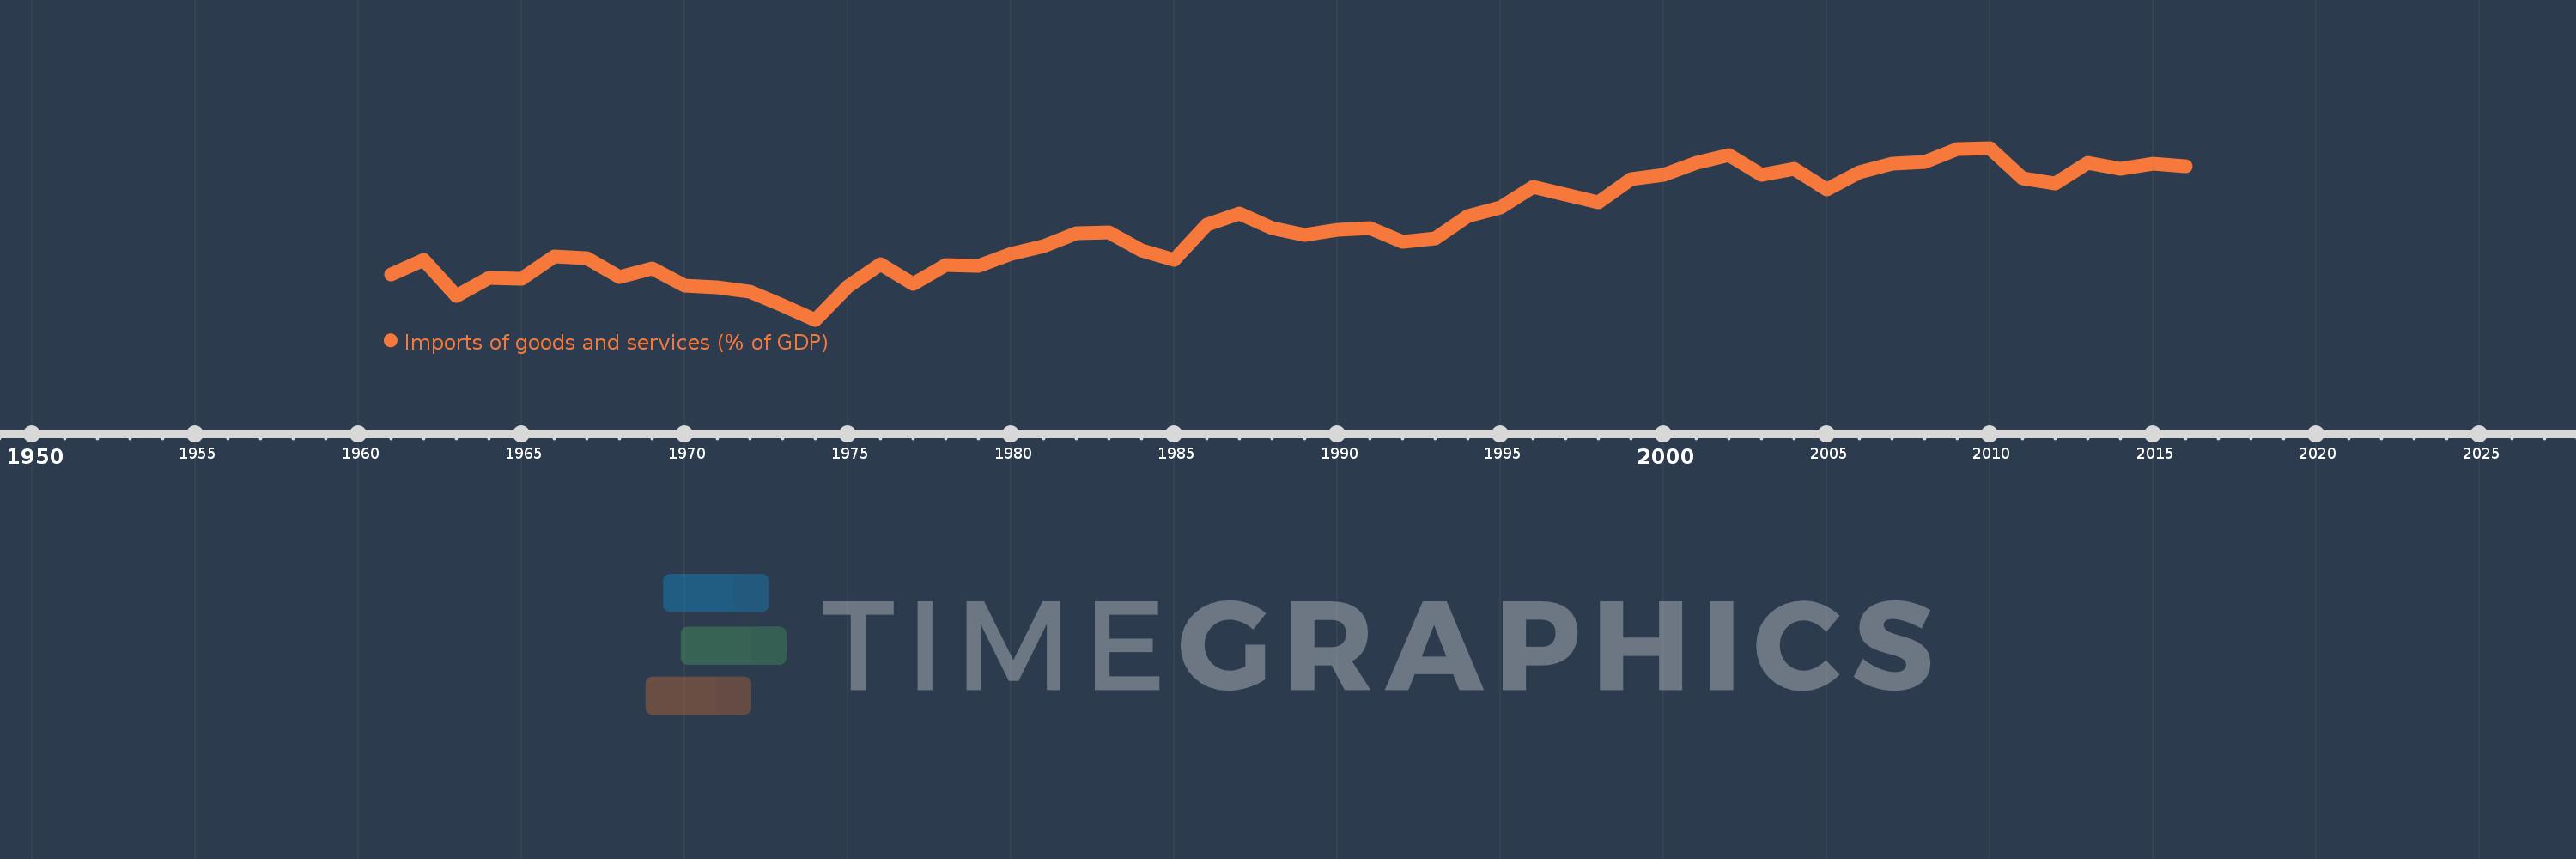
Imports of goods and services (% of GDP)
2016,2015,2014,2013,2012,2011,2010,2009,2008,2007,2006,2005,2004,2003,2002,2001,2000,1999,1998,1997,1996,1995,1994,1993,1992,1991,1990,1989,1988,1987,1986,1985,1984,1983,1982,1981,1980,1979,1978,1977,1976,1975,1974,1973,1972,1971,1970,1969,1968,1967,1966,1965,1964,1963,1962,1961
This statistics in other country:
AfghanistanAlbaniaAlgeriaAngolaAntigua and BarbudaArab WorldArgentinaArmeniaArubaAustraliaAustriaAzerbaijanBahamas, TheBahrainBangladeshBarbadosBelarusBelgiumBelizeBeninBermudaBhutanBoliviaBosnia and HerzegovinaBotswanaBrazilBrunei DarussalamBulgariaBurkina FasoBurundiCabo VerdeCambodiaCameroonCanadaCaribbean small statesCentral African RepublicCentral Europe and the BalticsChadChileChinaColombiaComorosCongo, Dem. Rep.Congo, Rep.Costa RicaCote d'IvoireCroatiaCubaCyprusCzech RepublicDenmarkDjiboutiDominicaDominican RepublicEarly-demographic dividendEast Asia & PacificEast Asia & Pacific (excluding high income)East Asia & Pacific (IDA & IBRD countries)EcuadorEgypt, Arab Rep.El SalvadorEquatorial GuineaEritreaEstoniaEthiopiaEuro areaEurope & Central AsiaEurope & Central Asia (excluding high income)Europe & Central Asia (IDA & IBRD countries)European UnionFaroe IslandsFijiFinlandFragile and conflict affected situationsFranceFrench PolynesiaGabonGambia, TheGeorgiaGermanyGhanaGreeceGrenadaGuatemalaGuineaGuinea-BissauGuyanaHaitiHeavily indebted poor countries (HIPC)High incomeHondurasHong Kong SAR, ChinaHungaryIBRD onlyIcelandIDA & IBRD totalIDA blendIDA onlyIDA totalIndiaIndonesiaIran, Islamic Rep.IraqIrelandIsraelItalyJamaicaJapanJordanKazakhstanKenyaKiribatiKorea, Rep.KosovoKuwaitKyrgyz RepublicLao PDRLate-demographic dividendLatin America & Caribbean Latin America & Caribbean (excluding high income)Latin America & the Caribbean (IDA & IBRD countries)LatviaLeast developed countries: UN classificationLebanonLesothoLiberiaLibyaLithuaniaLow & middle incomeLow incomeLower middle incomeLuxembourgMacao SAR, ChinaMacedonia, FYRMadagascarMalawiMalaysiaMaldivesMaliMaltaMauritaniaMauritiusMexicoMicronesia, Fed. Sts.Middle East & North AfricaMiddle East & North Africa (excluding high income)Middle East & North Africa (IDA & IBRD countries)Middle incomeMoldovaMongoliaMontenegroMoroccoMozambiqueMyanmarNamibiaNepalNetherlandsNew CaledoniaNew ZealandNicaraguaNigerNigeriaNorth AmericaNorwayOECD membersOmanOther small statesPacific island small statesPakistanPalauPanamaPapua New GuineaParaguayPeruPhilippinesPolandPortugalPost-demographic dividendPre-demographic dividendPuerto RicoQatarRomaniaRussian FederationRwandaSamoaSaudi ArabiaSenegalSerbiaSeychellesSierra LeoneSingaporeSlovak RepublicSloveniaSmall statesSolomon IslandsSomaliaSouth AfricaSouth AsiaSouth Asia (IDA & IBRD)South SudanSpainSri LankaSt. Kitts and NevisSt. LuciaSt. Vincent and the GrenadinesSub-Saharan Africa Sub-Saharan Africa (excluding high income)Sub-Saharan Africa (IDA & IBRD countries)SudanSurinameSwazilandSwedenSwitzerlandSyrian Arab RepublicTajikistanTanzaniaThailandTimor-LesteTogoTongaTrinidad and TobagoTunisiaTurkeyTurkmenistanUgandaUkraineUnited Arab EmiratesUnited KingdomUnited StatesUpper middle incomeUruguayUzbekistanVanuatuVenezuela, RBVietnamWest Bank and GazaWorldYemen, Rep.ZambiaZimbabwe Timeline:
This timeline shows a graph from 1961 to 2016 of Australia. No data until 1960. Number of actual observations by date: 56.
Source name:
World Development Indicators
Source organization:
World Bank national accounts data, and OECD National Accounts data files.
Categories, topics:
Economy & Growth, Trade
Last updated:
apr 23, 2017
Indicators value changes by year
Minimum:
11.089
jan 1, 1974
Maximum:
22.423
jan 1, 2010
At the date of observation
Value
Absolute change
Change from previous value
jan 1, 1961
14.066
+14.066
0.0%
jan 1, 1962
15.032
+0.966
6.87%
jan 1, 1963
12.634
-2.398
-15.95%
jan 1, 1964
13.837
+1.203
9.52%
jan 1, 1965
13.767
-0.07
-0.5%
jan 1, 1966
15.271
+1.504
10.92%
jan 1, 1967
15.136
-0.134
-0.88%
jan 1, 1968
13.899
-1.238
-8.18%
jan 1, 1969
14.493
+0.594
4.27%
jan 1, 1970
13.339
-1.154
-7.96%
jan 1, 1971
13.226
-0.113
-0.84%
jan 1, 1972
12.942
-0.284
-2.15%
jan 1, 1973
12.038
-0.904
-6.99%
jan 1, 1974
11.089
-0.949
-7.89%
jan 1, 1975
13.275
+2.186
19.72%
jan 1, 1976
14.783
+1.509
11.36%
jan 1, 1977
13.425
-1.358
-9.19%
jan 1, 1978
14.696
+1.271
9.47%
jan 1, 1979
14.638
-0.059
-0.4%
jan 1, 1980
15.413
+0.775
5.29%
jan 1, 1981
15.965
+0.553
3.59%
jan 1, 1982
16.791
+0.826
5.17%
jan 1, 1983
16.879
+0.087
0.52%
jan 1, 1984
15.674
-1.205
-7.14%
jan 1, 1985
15.045
-0.628
-4.01%
jan 1, 1986
17.347
+2.302
15.3%
jan 1, 1987
18.122
+0.775
4.47%
jan 1, 1988
17.127
-0.995
-5.49%
jan 1, 1989
16.676
-0.452
-2.64%
jan 1, 1990
17.017
+0.342
2.05%
jan 1, 1991
17.126
+0.109
0.64%
jan 1, 1992
16.246
-0.881
-5.14%
jan 1, 1993
16.469
+0.224
1.38%
jan 1, 1994
17.926
+1.457
8.85%
jan 1, 1995
18.505
+0.579
3.23%
jan 1, 1996
19.85
+1.345
7.27%
jan 1, 1997
19.328
-0.522
-2.63%
jan 1, 1998
18.82
-0.508
-2.63%
jan 1, 1999
20.378
+1.558
8.28%
jan 1, 2000
20.647
+0.269
1.32%
jan 1, 2001
21.468
+0.821
3.98%
jan 1, 2002
21.971
+0.502
2.34%
jan 1, 2003
20.652
-1.319
-6.0%
jan 1, 2004
21.046
+0.394
1.91%
jan 1, 2005
19.714
-1.331
-6.33%
jan 1, 2006
20.791
+1.076
5.46%
jan 1, 2007
21.413
+0.622
2.99%
jan 1, 2008
21.507
+0.094
0.44%
jan 1, 2009
22.359
+0.853
3.97%
jan 1, 2010
22.423
+0.063
0.28%
jan 1, 2011
20.416
-2.007
-8.95%
jan 1, 2012
20.102
-0.314
-1.54%
jan 1, 2013
21.416
+1.314
6.54%
jan 1, 2014
21.06
-0.356
-1.66%
jan 1, 2015
21.398
+0.338
1.6%
jan 1, 2016
21.209
-0.188
-0.88%
Ranking of countries by current statistics by years


Comments: