29
/
en
AIzaSyAYiBZKx7MnpbEhh9jyipgxe19OcubqV5w
April 1, 2024
178972
Liberia
LBR
true
2
1
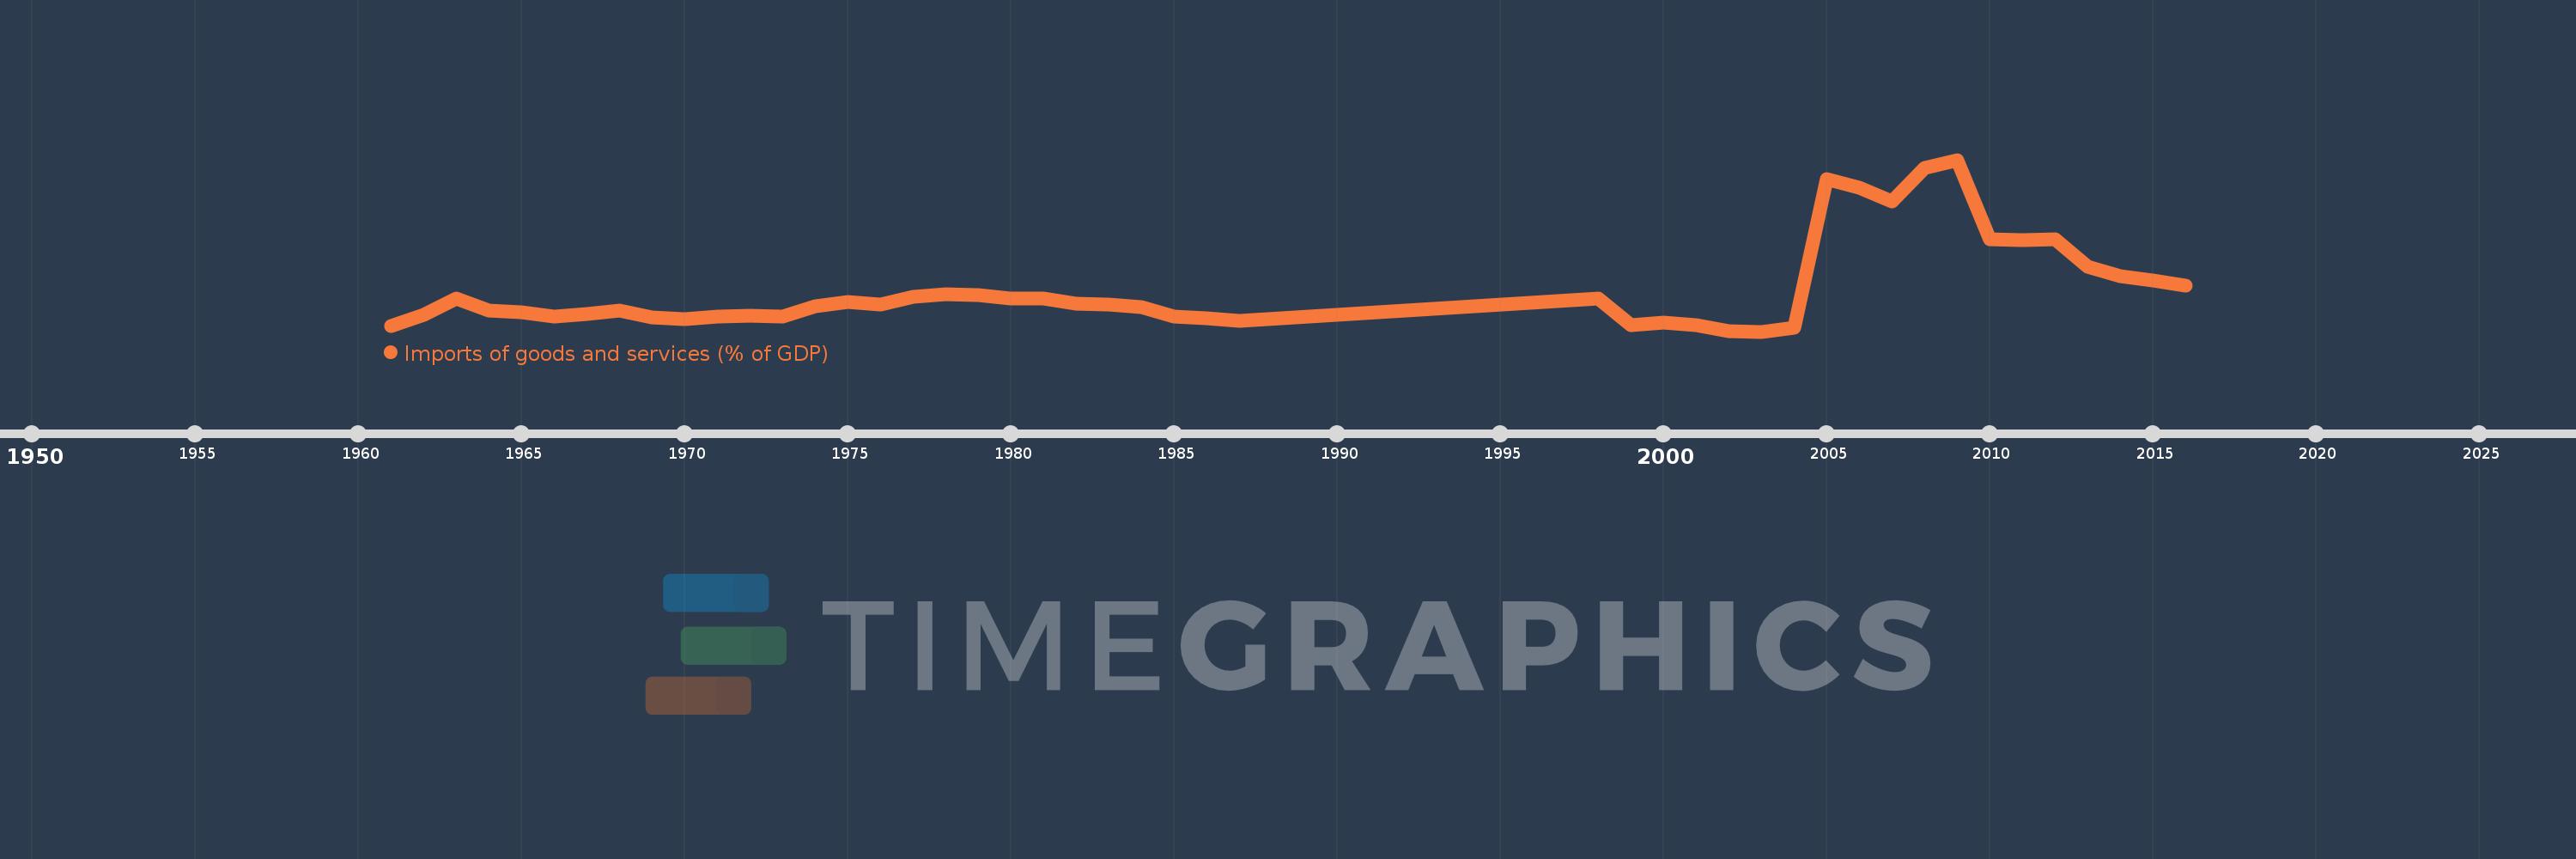
Imports of goods and services (% of GDP)
2016,2015,2014,2013,2012,2011,2010,2009,2008,2007,2006,2005,2004,2003,2002,2001,2000,1999,1998,1987,1986,1985,1984,1983,1982,1981,1980,1979,1978,1977,1976,1975,1974,1973,1972,1971,1970,1969,1968,1967,1966,1965,1964,1963,1962,1961
This statistics in other country:
AfghanistanAlbaniaAlgeriaAngolaAntigua and BarbudaArab WorldArgentinaArmeniaArubaAustraliaAustriaAzerbaijanBahamas, TheBahrainBangladeshBarbadosBelarusBelgiumBelizeBeninBermudaBhutanBoliviaBosnia and HerzegovinaBotswanaBrazilBrunei DarussalamBulgariaBurkina FasoBurundiCabo VerdeCambodiaCameroonCanadaCaribbean small statesCentral African RepublicCentral Europe and the BalticsChadChileChinaColombiaComorosCongo, Dem. Rep.Congo, Rep.Costa RicaCote d'IvoireCroatiaCubaCyprusCzech RepublicDenmarkDjiboutiDominicaDominican RepublicEarly-demographic dividendEast Asia & PacificEast Asia & Pacific (excluding high income)East Asia & Pacific (IDA & IBRD countries)EcuadorEgypt, Arab Rep.El SalvadorEquatorial GuineaEritreaEstoniaEthiopiaEuro areaEurope & Central AsiaEurope & Central Asia (excluding high income)Europe & Central Asia (IDA & IBRD countries)European UnionFaroe IslandsFijiFinlandFragile and conflict affected situationsFranceFrench PolynesiaGabonGambia, TheGeorgiaGermanyGhanaGreeceGrenadaGuatemalaGuineaGuinea-BissauGuyanaHaitiHeavily indebted poor countries (HIPC)High incomeHondurasHong Kong SAR, ChinaHungaryIBRD onlyIcelandIDA & IBRD totalIDA blendIDA onlyIDA totalIndiaIndonesiaIran, Islamic Rep.IraqIrelandIsraelItalyJamaicaJapanJordanKazakhstanKenyaKiribatiKorea, Rep.KosovoKuwaitKyrgyz RepublicLao PDRLate-demographic dividendLatin America & Caribbean Latin America & Caribbean (excluding high income)Latin America & the Caribbean (IDA & IBRD countries)LatviaLeast developed countries: UN classificationLebanonLesothoLiberiaLibyaLithuaniaLow & middle incomeLow incomeLower middle incomeLuxembourgMacao SAR, ChinaMacedonia, FYRMadagascarMalawiMalaysiaMaldivesMaliMaltaMauritaniaMauritiusMexicoMicronesia, Fed. Sts.Middle East & North AfricaMiddle East & North Africa (excluding high income)Middle East & North Africa (IDA & IBRD countries)Middle incomeMoldovaMongoliaMontenegroMoroccoMozambiqueMyanmarNamibiaNepalNetherlandsNew CaledoniaNew ZealandNicaraguaNigerNigeriaNorth AmericaNorwayOECD membersOmanOther small statesPacific island small statesPakistanPalauPanamaPapua New GuineaParaguayPeruPhilippinesPolandPortugalPost-demographic dividendPre-demographic dividendPuerto RicoQatarRomaniaRussian FederationRwandaSamoaSaudi ArabiaSenegalSerbiaSeychellesSierra LeoneSingaporeSlovak RepublicSloveniaSmall statesSolomon IslandsSomaliaSouth AfricaSouth AsiaSouth Asia (IDA & IBRD)South SudanSpainSri LankaSt. Kitts and NevisSt. LuciaSt. Vincent and the GrenadinesSub-Saharan Africa Sub-Saharan Africa (excluding high income)Sub-Saharan Africa (IDA & IBRD countries)SudanSurinameSwazilandSwedenSwitzerlandSyrian Arab RepublicTajikistanTanzaniaThailandTimor-LesteTogoTongaTrinidad and TobagoTunisiaTurkeyTurkmenistanUgandaUkraineUnited Arab EmiratesUnited KingdomUnited StatesUpper middle incomeUruguayUzbekistanVanuatuVenezuela, RBVietnamWest Bank and GazaWorldYemen, Rep.ZambiaZimbabwe Timeline:
This timeline shows a graph from 1961 to 2016 of Liberia. No data until 1960. Number of actual observations by date: 46.
Source name:
World Development Indicators
Source organization:
World Bank national accounts data, and OECD National Accounts data files.
Categories, topics:
Economy & Growth, Trade
Last updated:
apr 23, 2017
Indicators value changes by year
Minimum:
30.779
jan 1, 2003
Maximum:
246.812
jan 1, 2009
At the date of observation
Value
Absolute change
Change from previous value
jan 1, 1961
38.321
+38.321
0.0%
jan 1, 1962
52.033
+13.712
35.78%
jan 1, 1963
72.396
+20.363
39.13%
jan 1, 1964
56.835
-15.561
-21.49%
jan 1, 1965
55.315
-1.52
-2.67%
jan 1, 1966
49.943
-5.372
-9.71%
jan 1, 1967
53.342
+3.399
6.81%
jan 1, 1968
56.815
+3.472
6.51%
jan 1, 1969
49.021
-7.794
-13.72%
jan 1, 1970
46.781
-2.24
-4.57%
jan 1, 1971
49.211
+2.43
5.19%
jan 1, 1972
51.033
+1.822
3.7%
jan 1, 1973
50.041
-0.992
-1.94%
jan 1, 1974
62.253
+12.212
24.4%
jan 1, 1975
68.199
+5.946
9.55%
jan 1, 1976
64.393
-3.807
-5.58%
jan 1, 1977
74.781
+10.388
16.13%
jan 1, 1978
77.547
+2.766
3.7%
jan 1, 1979
76.488
-1.059
-1.37%
jan 1, 1980
72.156
-4.331
-5.66%
jan 1, 1981
71.837
-0.319
-0.44%
jan 1, 1982
66.26
-5.577
-7.76%
jan 1, 1983
64.704
-1.556
-2.35%
jan 1, 1984
61.454
-3.25
-5.02%
jan 1, 1985
50.208
-11.247
-18.3%
jan 1, 1986
47.575
-2.633
-5.24%
jan 1, 1987
43.878
-3.696
-7.77%
jan 1, 1998
71.984
+28.106
64.05%
jan 1, 1999
39.349
-32.635
-45.34%
jan 1, 2000
41.67
+2.321
5.9%
jan 1, 2001
38.937
-2.734
-6.56%
jan 1, 2002
31.418
-7.519
-19.31%
jan 1, 2003
30.779
-0.64
-2.04%
jan 1, 2004
35.864
+5.085
16.52%
jan 1, 2005
222.878
+187.014
521.45%
jan 1, 2006
211.273
-11.605
-5.21%
jan 1, 2007
194.693
-16.58
-7.85%
jan 1, 2008
236.392
+41.699
21.42%
jan 1, 2009
246.812
+10.42
4.41%
jan 1, 2010
146.475
-100.337
-40.65%
jan 1, 2011
146.283
-0.192
-0.13%
jan 1, 2012
147.146
+0.863
0.59%
jan 1, 2013
112.244
-34.902
-23.72%
jan 1, 2014
100.385
-11.859
-10.57%
jan 1, 2015
94.933
-5.452
-5.43%
jan 1, 2016
88.914
-6.019
-6.34%
Ranking of countries by current statistics by years


Comments: