29
/
en
AIzaSyAYiBZKx7MnpbEhh9jyipgxe19OcubqV5w
April 1, 2024
254239
Suriname
SUR
true
2
1
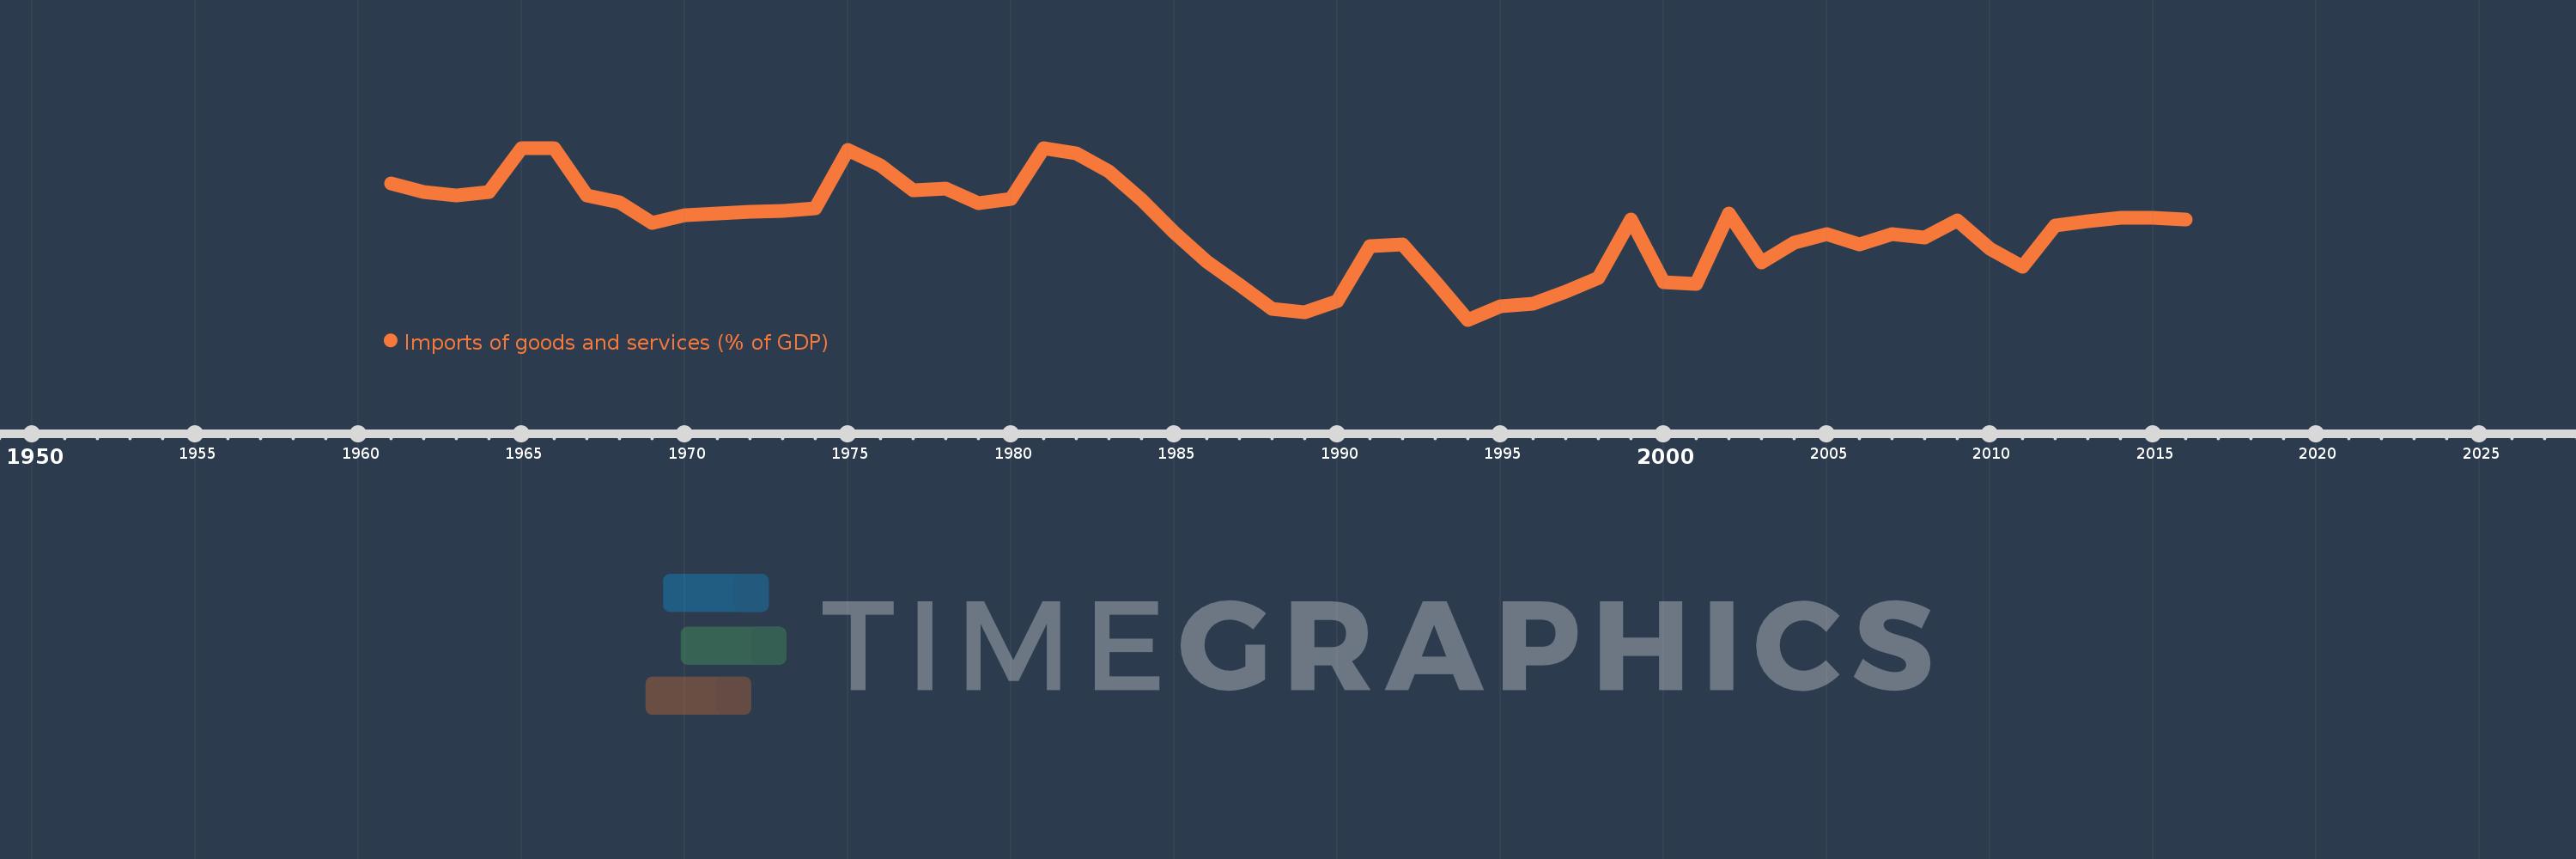
Imports of goods and services (% of GDP)
2016,2015,2014,2013,2012,2011,2010,2009,2008,2007,2006,2005,2004,2003,2002,2001,2000,1999,1998,1997,1996,1995,1994,1993,1992,1991,1990,1989,1988,1987,1986,1985,1984,1983,1982,1981,1980,1979,1978,1977,1976,1975,1974,1973,1972,1971,1970,1969,1968,1967,1966,1965,1964,1963,1962,1961
This statistics in other country:
AfghanistanAlbaniaAlgeriaAngolaAntigua and BarbudaArab WorldArgentinaArmeniaArubaAustraliaAustriaAzerbaijanBahamas, TheBahrainBangladeshBarbadosBelarusBelgiumBelizeBeninBermudaBhutanBoliviaBosnia and HerzegovinaBotswanaBrazilBrunei DarussalamBulgariaBurkina FasoBurundiCabo VerdeCambodiaCameroonCanadaCaribbean small statesCentral African RepublicCentral Europe and the BalticsChadChileChinaColombiaComorosCongo, Dem. Rep.Congo, Rep.Costa RicaCote d'IvoireCroatiaCubaCyprusCzech RepublicDenmarkDjiboutiDominicaDominican RepublicEarly-demographic dividendEast Asia & PacificEast Asia & Pacific (excluding high income)East Asia & Pacific (IDA & IBRD countries)EcuadorEgypt, Arab Rep.El SalvadorEquatorial GuineaEritreaEstoniaEthiopiaEuro areaEurope & Central AsiaEurope & Central Asia (excluding high income)Europe & Central Asia (IDA & IBRD countries)European UnionFaroe IslandsFijiFinlandFragile and conflict affected situationsFranceFrench PolynesiaGabonGambia, TheGeorgiaGermanyGhanaGreeceGrenadaGuatemalaGuineaGuinea-BissauGuyanaHaitiHeavily indebted poor countries (HIPC)High incomeHondurasHong Kong SAR, ChinaHungaryIBRD onlyIcelandIDA & IBRD totalIDA blendIDA onlyIDA totalIndiaIndonesiaIran, Islamic Rep.IraqIrelandIsraelItalyJamaicaJapanJordanKazakhstanKenyaKiribatiKorea, Rep.KosovoKuwaitKyrgyz RepublicLao PDRLate-demographic dividendLatin America & Caribbean Latin America & Caribbean (excluding high income)Latin America & the Caribbean (IDA & IBRD countries)LatviaLeast developed countries: UN classificationLebanonLesothoLiberiaLibyaLithuaniaLow & middle incomeLow incomeLower middle incomeLuxembourgMacao SAR, ChinaMacedonia, FYRMadagascarMalawiMalaysiaMaldivesMaliMaltaMauritaniaMauritiusMexicoMicronesia, Fed. Sts.Middle East & North AfricaMiddle East & North Africa (excluding high income)Middle East & North Africa (IDA & IBRD countries)Middle incomeMoldovaMongoliaMontenegroMoroccoMozambiqueMyanmarNamibiaNepalNetherlandsNew CaledoniaNew ZealandNicaraguaNigerNigeriaNorth AmericaNorwayOECD membersOmanOther small statesPacific island small statesPakistanPalauPanamaPapua New GuineaParaguayPeruPhilippinesPolandPortugalPost-demographic dividendPre-demographic dividendPuerto RicoQatarRomaniaRussian FederationRwandaSamoaSaudi ArabiaSenegalSerbiaSeychellesSierra LeoneSingaporeSlovak RepublicSloveniaSmall statesSolomon IslandsSomaliaSouth AfricaSouth AsiaSouth Asia (IDA & IBRD)South SudanSpainSri LankaSt. Kitts and NevisSt. LuciaSt. Vincent and the GrenadinesSub-Saharan Africa Sub-Saharan Africa (excluding high income)Sub-Saharan Africa (IDA & IBRD countries)SudanSurinameSwazilandSwedenSwitzerlandSyrian Arab RepublicTajikistanTanzaniaThailandTimor-LesteTogoTongaTrinidad and TobagoTunisiaTurkeyTurkmenistanUgandaUkraineUnited Arab EmiratesUnited KingdomUnited StatesUpper middle incomeUruguayUzbekistanVanuatuVenezuela, RBVietnamWest Bank and GazaWorldYemen, Rep.ZambiaZimbabwe Timeline:
This timeline shows a graph from 1961 to 2016 of Suriname. No data until 1960. Number of actual observations by date: 56.
Source name:
World Development Indicators
Source organization:
World Bank national accounts data, and OECD National Accounts data files.
Categories, topics:
Economy & Growth, Trade
Last updated:
apr 23, 2017
Indicators value changes by year
Minimum:
22.243
jan 1, 1994
Maximum:
74.252
jan 1, 1966
At the date of observation
Value
Absolute change
Change from previous value
jan 1, 1961
63.399
+63.399
0.0%
jan 1, 1962
60.874
-2.525
-3.98%
jan 1, 1963
60.0
-0.874
-1.44%
jan 1, 1964
60.955
+0.955
1.59%
jan 1, 1965
74.1
+13.146
21.57%
jan 1, 1966
74.252
+0.152
0.2%
jan 1, 1967
59.877
-14.374
-19.36%
jan 1, 1968
57.672
-2.205
-3.68%
jan 1, 1969
51.564
-6.108
-10.59%
jan 1, 1970
53.866
+2.302
4.46%
jan 1, 1971
54.38
+0.514
0.95%
jan 1, 1972
54.812
+0.433
0.8%
jan 1, 1973
55.076
+0.264
0.48%
jan 1, 1974
56.01
+0.934
1.7%
jan 1, 1975
73.657
+17.647
31.51%
jan 1, 1976
68.925
-4.732
-6.42%
jan 1, 1977
61.325
-7.599
-11.03%
jan 1, 1978
62.012
+0.687
1.12%
jan 1, 1979
57.648
-4.365
-7.04%
jan 1, 1980
58.876
+1.228
2.13%
jan 1, 1981
74.223
+15.347
26.07%
jan 1, 1982
72.662
-1.561
-2.1%
jan 1, 1983
67.257
-5.405
-7.44%
jan 1, 1984
58.573
-8.684
-12.91%
jan 1, 1985
48.782
-9.791
-16.72%
jan 1, 1986
39.903
-8.879
-18.2%
jan 1, 1987
32.71
-7.192
-18.02%
jan 1, 1988
25.621
-7.089
-21.67%
jan 1, 1989
24.386
-1.235
-4.82%
jan 1, 1990
27.822
+3.436
14.09%
jan 1, 1991
44.445
+16.623
59.75%
jan 1, 1992
44.952
+0.507
1.14%
jan 1, 1993
33.772
-11.18
-24.87%
jan 1, 1994
22.243
-11.529
-34.14%
jan 1, 1995
26.399
+4.156
18.69%
jan 1, 1996
27.207
+0.808
3.06%
jan 1, 1997
30.76
+3.553
13.06%
jan 1, 1998
34.794
+4.033
13.11%
jan 1, 1999
52.486
+17.692
50.85%
jan 1, 2000
33.634
-18.851
-35.92%
jan 1, 2001
33.199
-0.435
-1.29%
jan 1, 2002
54.427
+21.228
63.94%
jan 1, 2003
39.589
-14.838
-27.26%
jan 1, 2004
45.555
+5.966
15.07%
jan 1, 2005
48.115
+2.561
5.62%
jan 1, 2006
45.157
-2.959
-6.15%
jan 1, 2007
48.167
+3.01
6.67%
jan 1, 2008
47.252
-0.915
-1.9%
jan 1, 2009
52.258
+5.006
10.59%
jan 1, 2010
43.796
-8.462
-16.19%
jan 1, 2011
38.414
-5.382
-12.29%
jan 1, 2012
50.689
+12.275
31.95%
jan 1, 2013
52.075
+1.386
2.73%
jan 1, 2014
53.13
+1.055
2.03%
jan 1, 2015
53.222
+0.092
0.17%
jan 1, 2016
52.463
-0.759
-1.43%
Ranking of countries by current statistics by years


Comments: