29
/
en
AIzaSyAYiBZKx7MnpbEhh9jyipgxe19OcubqV5w
April 1, 2024
195676
Mexico
MEX
true
2
1
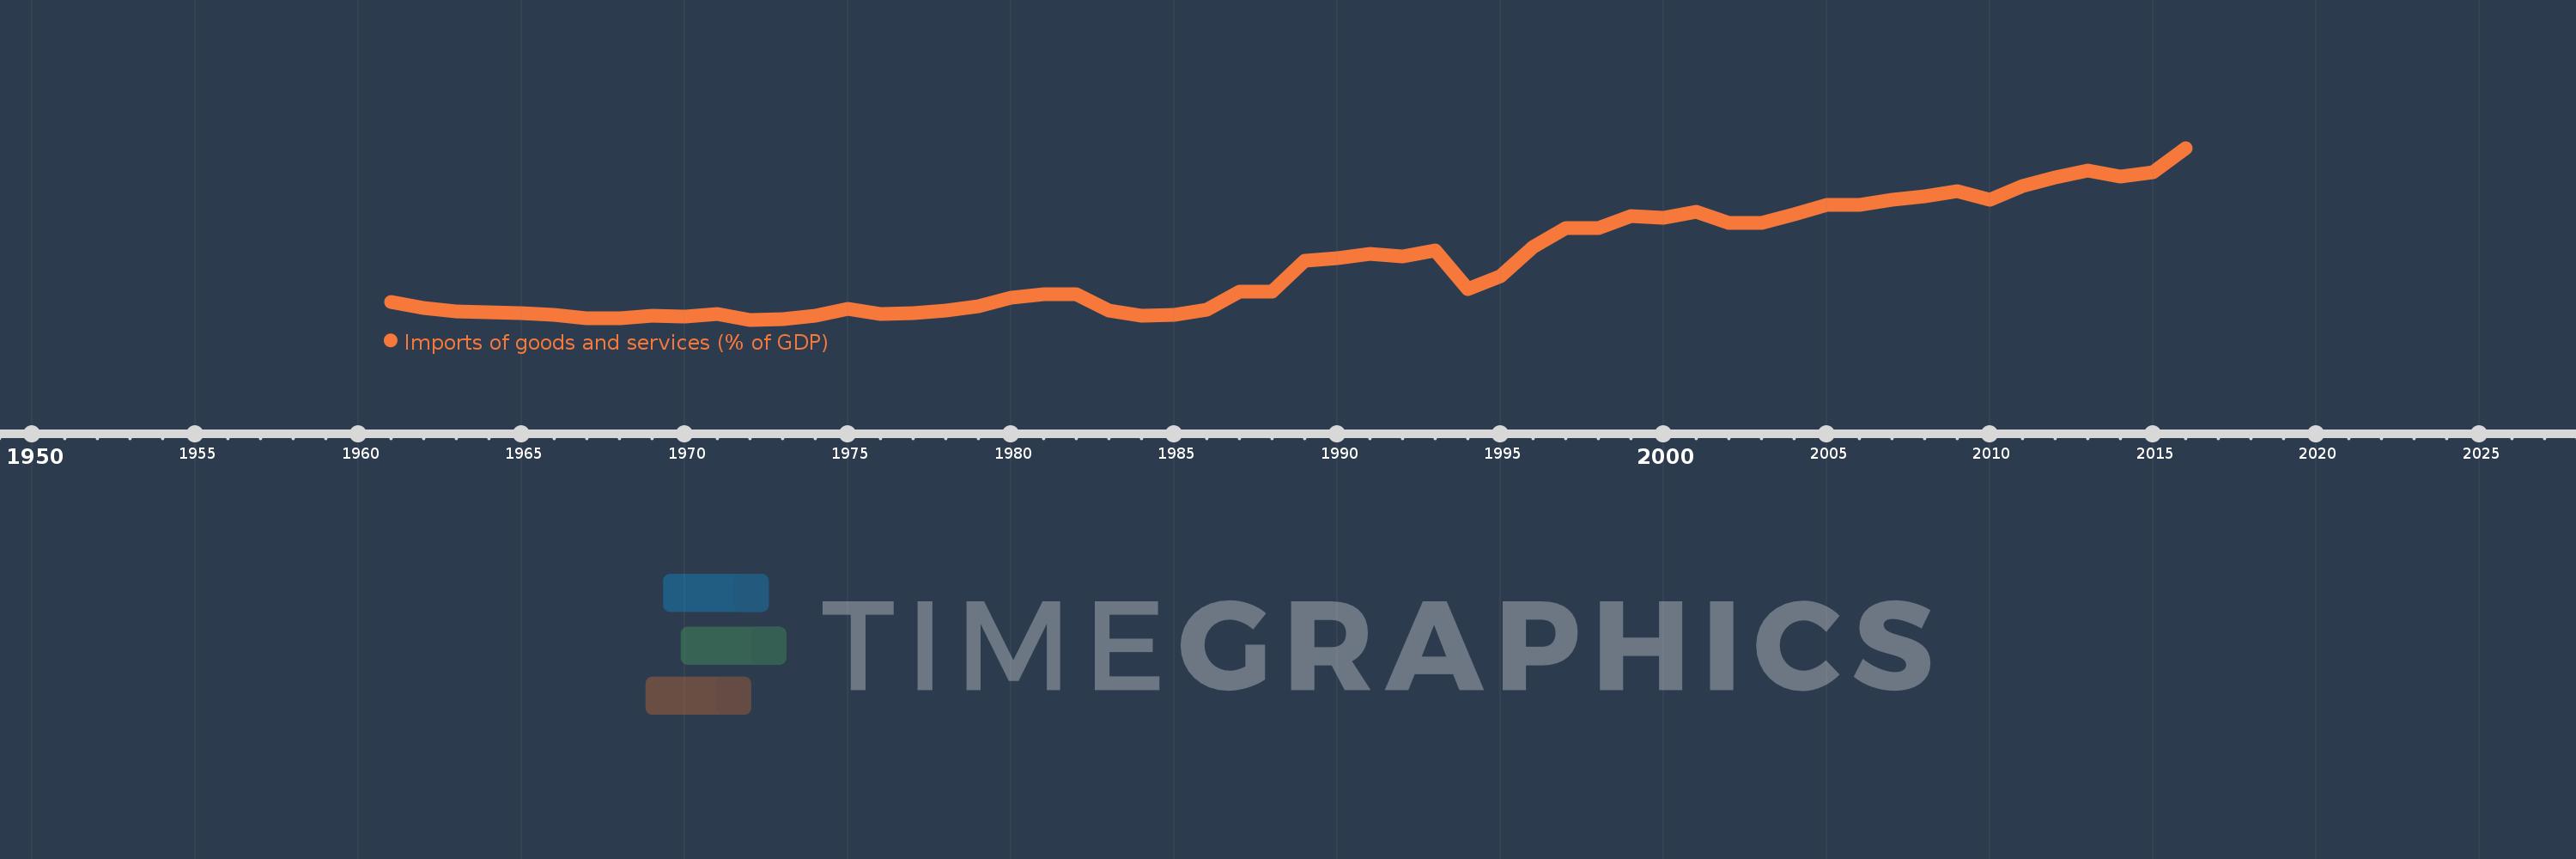
Imports of goods and services (% of GDP)
2016,2015,2014,2013,2012,2011,2010,2009,2008,2007,2006,2005,2004,2003,2002,2001,2000,1999,1998,1997,1996,1995,1994,1993,1992,1991,1990,1989,1988,1987,1986,1985,1984,1983,1982,1981,1980,1979,1978,1977,1976,1975,1974,1973,1972,1971,1970,1969,1968,1967,1966,1965,1964,1963,1962,1961
This statistics in other country:
AfghanistanAlbaniaAlgeriaAngolaAntigua and BarbudaArab WorldArgentinaArmeniaArubaAustraliaAustriaAzerbaijanBahamas, TheBahrainBangladeshBarbadosBelarusBelgiumBelizeBeninBermudaBhutanBoliviaBosnia and HerzegovinaBotswanaBrazilBrunei DarussalamBulgariaBurkina FasoBurundiCabo VerdeCambodiaCameroonCanadaCaribbean small statesCentral African RepublicCentral Europe and the BalticsChadChileChinaColombiaComorosCongo, Dem. Rep.Congo, Rep.Costa RicaCote d'IvoireCroatiaCubaCyprusCzech RepublicDenmarkDjiboutiDominicaDominican RepublicEarly-demographic dividendEast Asia & PacificEast Asia & Pacific (excluding high income)East Asia & Pacific (IDA & IBRD countries)EcuadorEgypt, Arab Rep.El SalvadorEquatorial GuineaEritreaEstoniaEthiopiaEuro areaEurope & Central AsiaEurope & Central Asia (excluding high income)Europe & Central Asia (IDA & IBRD countries)European UnionFaroe IslandsFijiFinlandFragile and conflict affected situationsFranceFrench PolynesiaGabonGambia, TheGeorgiaGermanyGhanaGreeceGrenadaGuatemalaGuineaGuinea-BissauGuyanaHaitiHeavily indebted poor countries (HIPC)High incomeHondurasHong Kong SAR, ChinaHungaryIBRD onlyIcelandIDA & IBRD totalIDA blendIDA onlyIDA totalIndiaIndonesiaIran, Islamic Rep.IraqIrelandIsraelItalyJamaicaJapanJordanKazakhstanKenyaKiribatiKorea, Rep.KosovoKuwaitKyrgyz RepublicLao PDRLate-demographic dividendLatin America & Caribbean Latin America & Caribbean (excluding high income)Latin America & the Caribbean (IDA & IBRD countries)LatviaLeast developed countries: UN classificationLebanonLesothoLiberiaLibyaLithuaniaLow & middle incomeLow incomeLower middle incomeLuxembourgMacao SAR, ChinaMacedonia, FYRMadagascarMalawiMalaysiaMaldivesMaliMaltaMauritaniaMauritiusMexicoMicronesia, Fed. Sts.Middle East & North AfricaMiddle East & North Africa (excluding high income)Middle East & North Africa (IDA & IBRD countries)Middle incomeMoldovaMongoliaMontenegroMoroccoMozambiqueMyanmarNamibiaNepalNetherlandsNew CaledoniaNew ZealandNicaraguaNigerNigeriaNorth AmericaNorwayOECD membersOmanOther small statesPacific island small statesPakistanPalauPanamaPapua New GuineaParaguayPeruPhilippinesPolandPortugalPost-demographic dividendPre-demographic dividendPuerto RicoQatarRomaniaRussian FederationRwandaSamoaSaudi ArabiaSenegalSerbiaSeychellesSierra LeoneSingaporeSlovak RepublicSloveniaSmall statesSolomon IslandsSomaliaSouth AfricaSouth AsiaSouth Asia (IDA & IBRD)South SudanSpainSri LankaSt. Kitts and NevisSt. LuciaSt. Vincent and the GrenadinesSub-Saharan Africa Sub-Saharan Africa (excluding high income)Sub-Saharan Africa (IDA & IBRD countries)SudanSurinameSwazilandSwedenSwitzerlandSyrian Arab RepublicTajikistanTanzaniaThailandTimor-LesteTogoTongaTrinidad and TobagoTunisiaTurkeyTurkmenistanUgandaUkraineUnited Arab EmiratesUnited KingdomUnited StatesUpper middle incomeUruguayUzbekistanVanuatuVenezuela, RBVietnamWest Bank and GazaWorldYemen, Rep.ZambiaZimbabwe Timeline:
This timeline shows a graph from 1961 to 2016 of Mexico. No data until 1960. Number of actual observations by date: 56.
Source name:
World Development Indicators
Source organization:
World Bank national accounts data, and OECD National Accounts data files.
Categories, topics:
Economy & Growth, Trade
Last updated:
apr 23, 2017
Indicators value changes by year
Maximum:
37.473
jan 1, 2016
At the date of observation
Value
Absolute change
Change from previous value
jan 1, 1961
11.649
+11.649
0.0%
jan 1, 1962
10.62
-1.029
-8.84%
jan 1, 1963
10.095
-0.525
-4.94%
jan 1, 1964
9.967
-0.127
-1.26%
jan 1, 1965
9.858
-0.109
-1.1%
jan 1, 1966
9.527
-0.331
-3.36%
jan 1, 1967
9.007
-0.52
-5.45%
jan 1, 1968
9.011
+0.003
0.04%
jan 1, 1969
9.352
+0.342
3.79%
jan 1, 1970
9.261
-0.092
-0.98%
jan 1, 1971
9.652
+0.391
4.22%
jan 1, 1972
8.719
-0.933
-9.66%
jan 1, 1973
8.834
+0.115
1.32%
jan 1, 1974
9.466
+0.632
7.16%
jan 1, 1975
10.576
+1.11
11.72%
jan 1, 1976
9.62
-0.956
-9.04%
jan 1, 1977
9.867
+0.248
2.58%
jan 1, 1978
10.221
+0.353
3.58%
jan 1, 1979
11.038
+0.817
7.99%
jan 1, 1980
12.453
+1.415
12.82%
jan 1, 1981
12.974
+0.521
4.18%
jan 1, 1982
12.936
-0.038
-0.29%
jan 1, 1983
10.316
-2.62
-20.26%
jan 1, 1984
9.421
-0.895
-8.67%
jan 1, 1985
9.553
+0.132
1.4%
jan 1, 1986
10.334
+0.781
8.18%
jan 1, 1987
13.434
+3.1
30.0%
jan 1, 1988
13.386
-0.048
-0.36%
jan 1, 1989
18.538
+5.152
38.49%
jan 1, 1990
19.062
+0.524
2.83%
jan 1, 1991
19.705
+0.644
3.38%
jan 1, 1992
19.272
-0.433
-2.2%
jan 1, 1993
20.272
+0.999
5.18%
jan 1, 1994
13.824
-6.447
-31.8%
jan 1, 1995
15.961
+2.136
15.45%
jan 1, 1996
20.938
+4.977
31.19%
jan 1, 1997
23.996
+3.057
14.6%
jan 1, 1998
24.089
+0.094
0.39%
jan 1, 1999
26.027
+1.938
8.04%
jan 1, 2000
25.787
-0.24
-0.92%
jan 1, 2001
26.854
+1.067
4.14%
jan 1, 2002
24.884
-1.97
-7.34%
jan 1, 2003
24.909
+0.025
0.1%
jan 1, 2004
26.339
+1.431
5.74%
jan 1, 2005
27.993
+1.654
6.28%
jan 1, 2006
28.009
+0.016
0.06%
jan 1, 2007
28.854
+0.845
3.02%
jan 1, 2008
29.324
+0.47
1.63%
jan 1, 2009
30.173
+0.849
2.89%
jan 1, 2010
28.754
-1.419
-4.7%
jan 1, 2011
31.075
+2.321
8.07%
jan 1, 2012
32.512
+1.437
4.63%
jan 1, 2013
33.763
+1.251
3.85%
jan 1, 2014
32.663
-1.101
-3.26%
jan 1, 2015
33.37
+0.707
2.17%
jan 1, 2016
37.473
+4.103
12.3%
Ranking of countries by current statistics by years


Comments: