29
/
en
AIzaSyAYiBZKx7MnpbEhh9jyipgxe19OcubqV5w
April 1, 2024
182194
Luxembourg
LUX
true
2
1
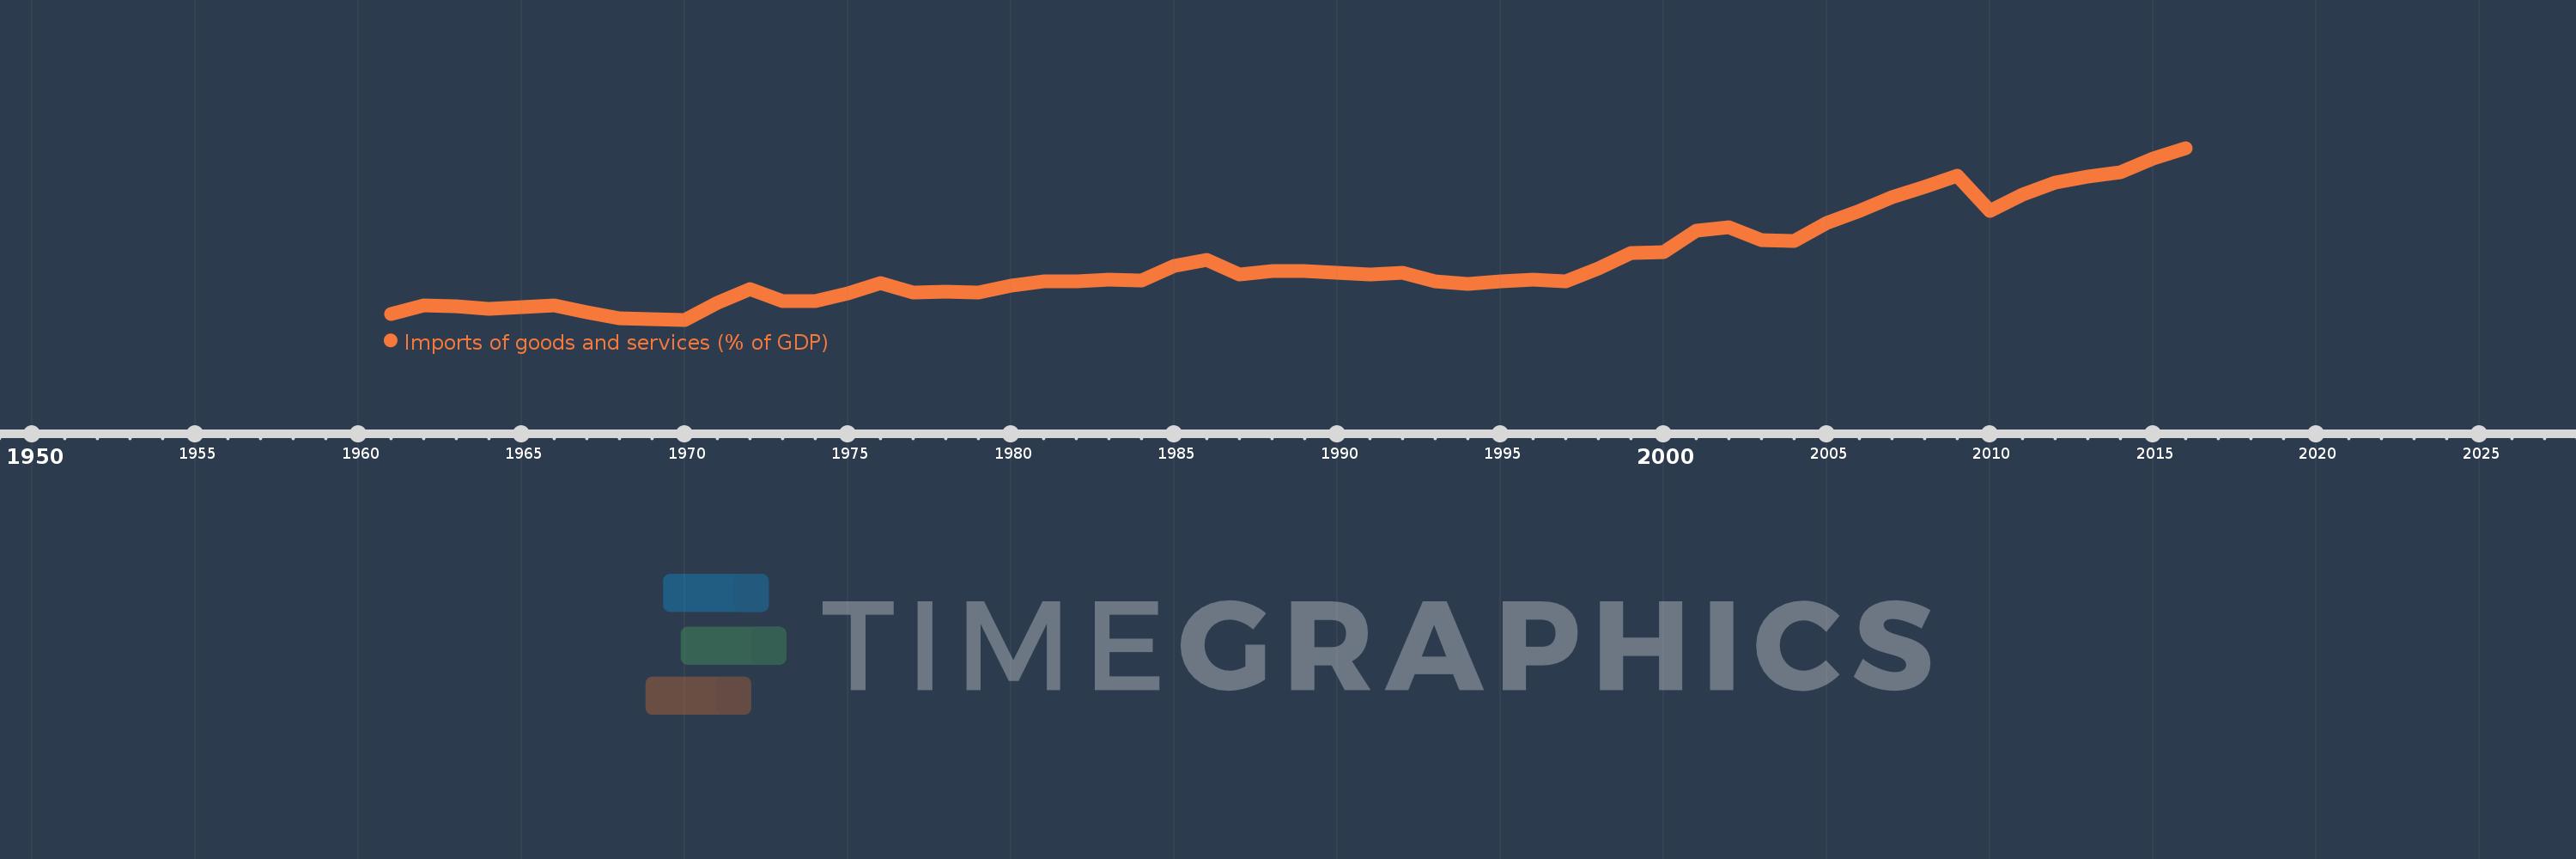
Imports of goods and services (% of GDP)
2016,2015,2014,2013,2012,2011,2010,2009,2008,2007,2006,2005,2004,2003,2002,2001,2000,1999,1998,1997,1996,1995,1994,1993,1992,1991,1990,1989,1988,1987,1986,1985,1984,1983,1982,1981,1980,1979,1978,1977,1976,1975,1974,1973,1972,1971,1970,1969,1968,1967,1966,1965,1964,1963,1962,1961
This statistics in other country:
AfghanistanAlbaniaAlgeriaAngolaAntigua and BarbudaArab WorldArgentinaArmeniaArubaAustraliaAustriaAzerbaijanBahamas, TheBahrainBangladeshBarbadosBelarusBelgiumBelizeBeninBermudaBhutanBoliviaBosnia and HerzegovinaBotswanaBrazilBrunei DarussalamBulgariaBurkina FasoBurundiCabo VerdeCambodiaCameroonCanadaCaribbean small statesCentral African RepublicCentral Europe and the BalticsChadChileChinaColombiaComorosCongo, Dem. Rep.Congo, Rep.Costa RicaCote d'IvoireCroatiaCubaCyprusCzech RepublicDenmarkDjiboutiDominicaDominican RepublicEarly-demographic dividendEast Asia & PacificEast Asia & Pacific (excluding high income)East Asia & Pacific (IDA & IBRD countries)EcuadorEgypt, Arab Rep.El SalvadorEquatorial GuineaEritreaEstoniaEthiopiaEuro areaEurope & Central AsiaEurope & Central Asia (excluding high income)Europe & Central Asia (IDA & IBRD countries)European UnionFaroe IslandsFijiFinlandFragile and conflict affected situationsFranceFrench PolynesiaGabonGambia, TheGeorgiaGermanyGhanaGreeceGrenadaGuatemalaGuineaGuinea-BissauGuyanaHaitiHeavily indebted poor countries (HIPC)High incomeHondurasHong Kong SAR, ChinaHungaryIBRD onlyIcelandIDA & IBRD totalIDA blendIDA onlyIDA totalIndiaIndonesiaIran, Islamic Rep.IraqIrelandIsraelItalyJamaicaJapanJordanKazakhstanKenyaKiribatiKorea, Rep.KosovoKuwaitKyrgyz RepublicLao PDRLate-demographic dividendLatin America & Caribbean Latin America & Caribbean (excluding high income)Latin America & the Caribbean (IDA & IBRD countries)LatviaLeast developed countries: UN classificationLebanonLesothoLiberiaLibyaLithuaniaLow & middle incomeLow incomeLower middle incomeLuxembourgMacao SAR, ChinaMacedonia, FYRMadagascarMalawiMalaysiaMaldivesMaliMaltaMauritaniaMauritiusMexicoMicronesia, Fed. Sts.Middle East & North AfricaMiddle East & North Africa (excluding high income)Middle East & North Africa (IDA & IBRD countries)Middle incomeMoldovaMongoliaMontenegroMoroccoMozambiqueMyanmarNamibiaNepalNetherlandsNew CaledoniaNew ZealandNicaraguaNigerNigeriaNorth AmericaNorwayOECD membersOmanOther small statesPacific island small statesPakistanPalauPanamaPapua New GuineaParaguayPeruPhilippinesPolandPortugalPost-demographic dividendPre-demographic dividendPuerto RicoQatarRomaniaRussian FederationRwandaSamoaSaudi ArabiaSenegalSerbiaSeychellesSierra LeoneSingaporeSlovak RepublicSloveniaSmall statesSolomon IslandsSomaliaSouth AfricaSouth AsiaSouth Asia (IDA & IBRD)South SudanSpainSri LankaSt. Kitts and NevisSt. LuciaSt. Vincent and the GrenadinesSub-Saharan Africa Sub-Saharan Africa (excluding high income)Sub-Saharan Africa (IDA & IBRD countries)SudanSurinameSwazilandSwedenSwitzerlandSyrian Arab RepublicTajikistanTanzaniaThailandTimor-LesteTogoTongaTrinidad and TobagoTunisiaTurkeyTurkmenistanUgandaUkraineUnited Arab EmiratesUnited KingdomUnited StatesUpper middle incomeUruguayUzbekistanVanuatuVenezuela, RBVietnamWest Bank and GazaWorldYemen, Rep.ZambiaZimbabwe Timeline:
This timeline shows a graph from 1961 to 2016 of Luxembourg. No data until 1960. Number of actual observations by date: 56.
Source name:
World Development Indicators
Source organization:
World Bank national accounts data, and OECD National Accounts data files.
Categories, topics:
Economy & Growth, Trade
Last updated:
apr 23, 2017
Indicators value changes by year
Minimum:
65.552
jan 1, 1970
Maximum:
177.648
jan 1, 2016
At the date of observation
Value
Absolute change
Change from previous value
jan 1, 1961
69.037
+69.037
0.0%
jan 1, 1962
75.141
+6.104
8.84%
jan 1, 1963
74.191
-0.95
-1.26%
jan 1, 1964
72.582
-1.61
-2.17%
jan 1, 1965
73.746
+1.164
1.6%
jan 1, 1966
75.103
+1.357
1.84%
jan 1, 1967
70.623
-4.48
-5.97%
jan 1, 1968
66.353
-4.27
-6.05%
jan 1, 1969
66.213
-0.14
-0.21%
jan 1, 1970
65.552
-0.662
-1.0%
jan 1, 1971
76.762
+11.211
17.1%
jan 1, 1972
85.546
+8.784
11.44%
jan 1, 1973
77.793
-7.753
-9.06%
jan 1, 1974
77.637
-0.156
-0.2%
jan 1, 1975
82.528
+4.891
6.3%
jan 1, 1976
89.317
+6.789
8.23%
jan 1, 1977
83.385
-5.932
-6.64%
jan 1, 1978
83.87
+0.486
0.58%
jan 1, 1979
83.46
-0.41
-0.49%
jan 1, 1980
88.021
+4.561
5.46%
jan 1, 1981
90.427
+2.406
2.73%
jan 1, 1982
90.73
+0.303
0.33%
jan 1, 1983
91.863
+1.134
1.25%
jan 1, 1984
91.264
-0.599
-0.65%
jan 1, 1985
100.727
+9.463
10.37%
jan 1, 1986
104.81
+4.083
4.05%
jan 1, 1987
95.368
-9.442
-9.01%
jan 1, 1988
97.193
+1.825
1.91%
jan 1, 1989
97.111
-0.082
-0.08%
jan 1, 1990
96.37
-0.741
-0.76%
jan 1, 1991
95.182
-1.188
-1.23%
jan 1, 1992
96.22
+1.037
1.09%
jan 1, 1993
90.699
-5.521
-5.74%
jan 1, 1994
89.175
-1.524
-1.68%
jan 1, 1995
90.373
+1.198
1.34%
jan 1, 1996
91.906
+1.533
1.7%
jan 1, 1997
90.624
-1.282
-1.39%
jan 1, 1998
99.162
+8.539
9.42%
jan 1, 1999
108.881
+9.718
9.8%
jan 1, 2000
109.43
+0.55
0.5%
jan 1, 2001
123.419
+13.988
12.78%
jan 1, 2002
125.842
+2.424
1.96%
jan 1, 2003
117.778
-8.065
-6.41%
jan 1, 2004
116.814
-0.963
-0.82%
jan 1, 2005
128.899
+12.085
10.35%
jan 1, 2006
136.462
+7.562
5.87%
jan 1, 2007
145.283
+8.822
6.46%
jan 1, 2008
152.075
+6.791
4.67%
jan 1, 2009
159.357
+7.282
4.79%
jan 1, 2010
136.478
-22.879
-14.36%
jan 1, 2011
147.13
+10.652
7.8%
jan 1, 2012
154.837
+7.707
5.24%
jan 1, 2013
158.885
+4.048
2.61%
jan 1, 2014
161.91
+3.025
1.9%
jan 1, 2015
170.879
+8.97
5.54%
jan 1, 2016
177.648
+6.768
3.96%
Ranking of countries by current statistics by years


Comments: