29
/
en
AIzaSyAYiBZKx7MnpbEhh9jyipgxe19OcubqV5w
April 1, 2024
205385
Namibia
NAM
true
2
1
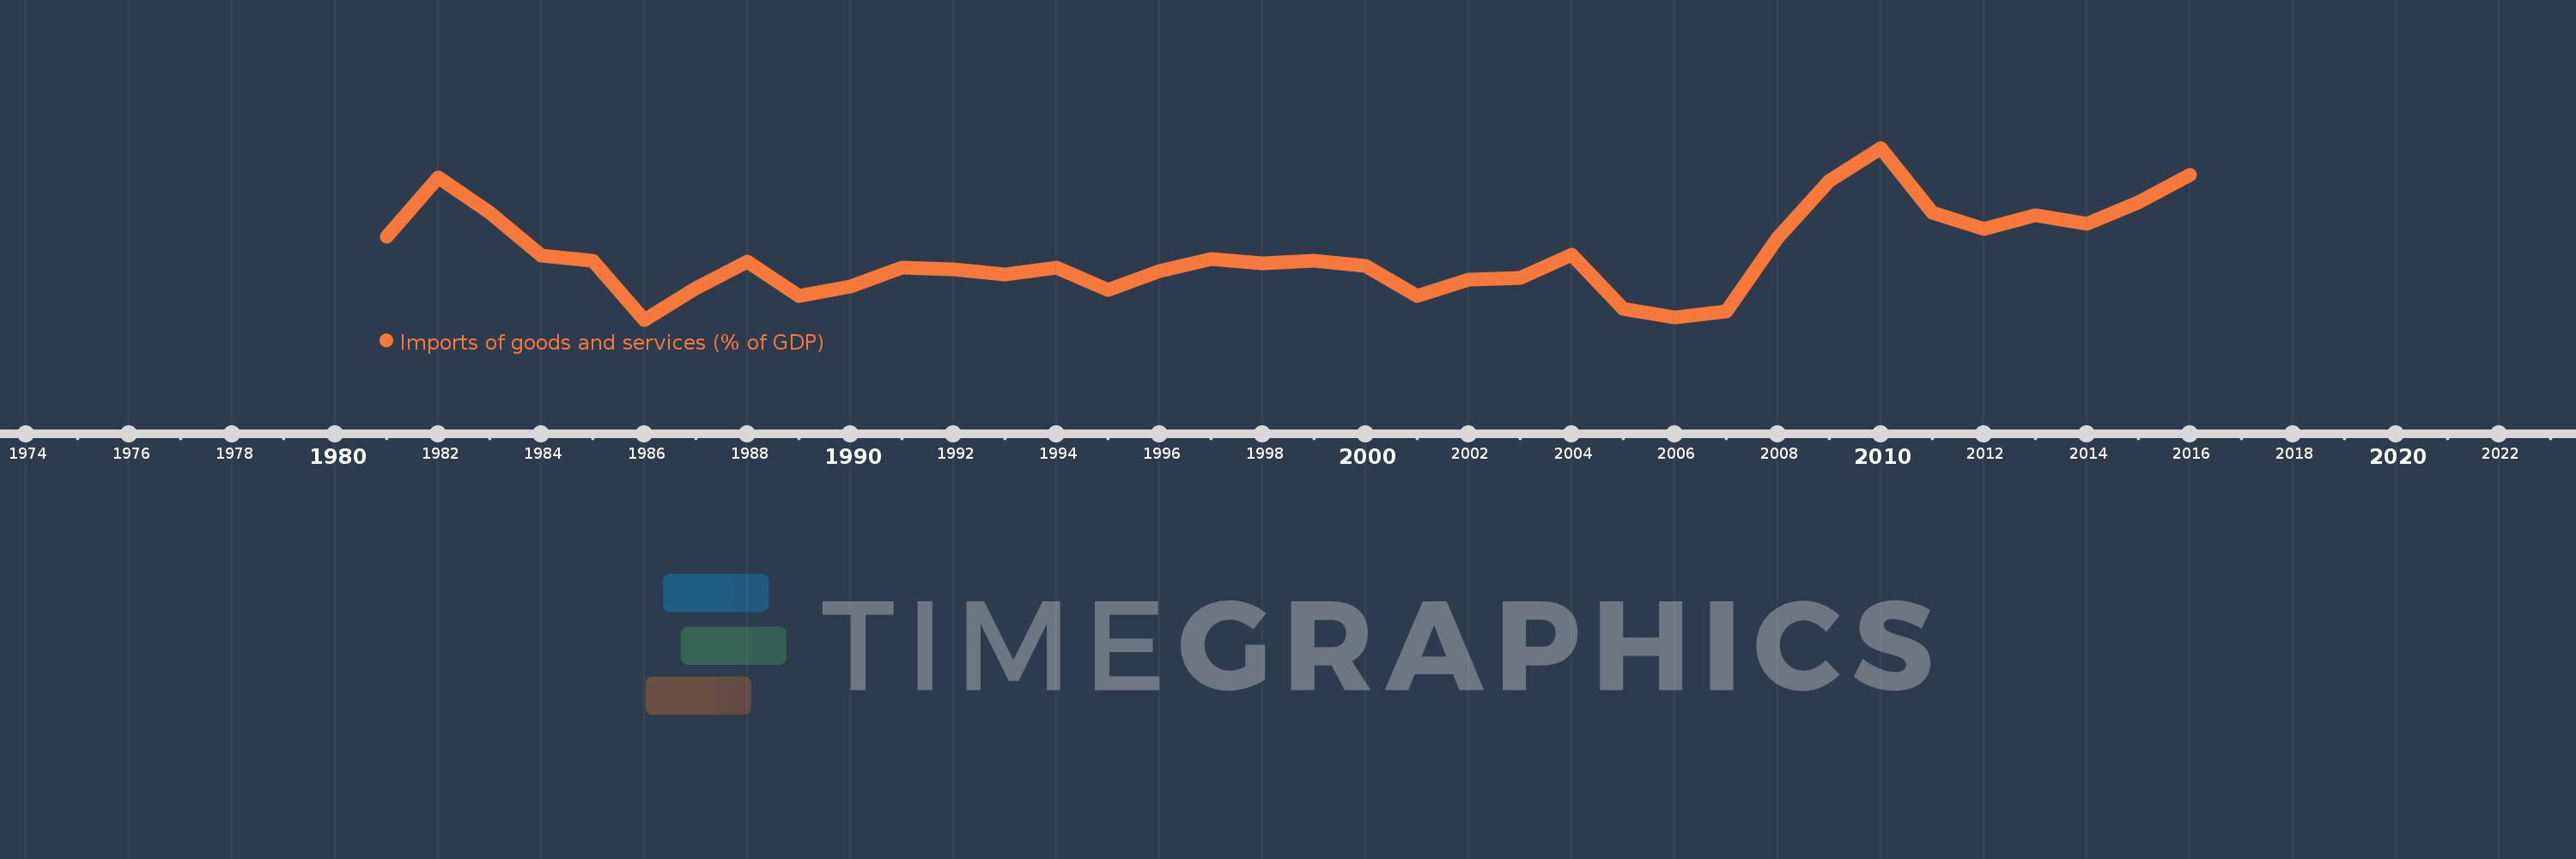
Imports of goods and services (% of GDP)
2016,2015,2014,2013,2012,2011,2010,2009,2008,2007,2006,2005,2004,2003,2002,2001,2000,1999,1998,1997,1996,1995,1994,1993,1992,1991,1990,1989,1988,1987,1986,1985,1984,1983,1982,1981
This statistics in other country:
AfghanistanAlbaniaAlgeriaAngolaAntigua and BarbudaArab WorldArgentinaArmeniaArubaAustraliaAustriaAzerbaijanBahamas, TheBahrainBangladeshBarbadosBelarusBelgiumBelizeBeninBermudaBhutanBoliviaBosnia and HerzegovinaBotswanaBrazilBrunei DarussalamBulgariaBurkina FasoBurundiCabo VerdeCambodiaCameroonCanadaCaribbean small statesCentral African RepublicCentral Europe and the BalticsChadChileChinaColombiaComorosCongo, Dem. Rep.Congo, Rep.Costa RicaCote d'IvoireCroatiaCubaCyprusCzech RepublicDenmarkDjiboutiDominicaDominican RepublicEarly-demographic dividendEast Asia & PacificEast Asia & Pacific (excluding high income)East Asia & Pacific (IDA & IBRD countries)EcuadorEgypt, Arab Rep.El SalvadorEquatorial GuineaEritreaEstoniaEthiopiaEuro areaEurope & Central AsiaEurope & Central Asia (excluding high income)Europe & Central Asia (IDA & IBRD countries)European UnionFaroe IslandsFijiFinlandFragile and conflict affected situationsFranceFrench PolynesiaGabonGambia, TheGeorgiaGermanyGhanaGreeceGrenadaGuatemalaGuineaGuinea-BissauGuyanaHaitiHeavily indebted poor countries (HIPC)High incomeHondurasHong Kong SAR, ChinaHungaryIBRD onlyIcelandIDA & IBRD totalIDA blendIDA onlyIDA totalIndiaIndonesiaIran, Islamic Rep.IraqIrelandIsraelItalyJamaicaJapanJordanKazakhstanKenyaKiribatiKorea, Rep.KosovoKuwaitKyrgyz RepublicLao PDRLate-demographic dividendLatin America & Caribbean Latin America & Caribbean (excluding high income)Latin America & the Caribbean (IDA & IBRD countries)LatviaLeast developed countries: UN classificationLebanonLesothoLiberiaLibyaLithuaniaLow & middle incomeLow incomeLower middle incomeLuxembourgMacao SAR, ChinaMacedonia, FYRMadagascarMalawiMalaysiaMaldivesMaliMaltaMauritaniaMauritiusMexicoMicronesia, Fed. Sts.Middle East & North AfricaMiddle East & North Africa (excluding high income)Middle East & North Africa (IDA & IBRD countries)Middle incomeMoldovaMongoliaMontenegroMoroccoMozambiqueMyanmarNamibiaNepalNetherlandsNew CaledoniaNew ZealandNicaraguaNigerNigeriaNorth AmericaNorwayOECD membersOmanOther small statesPacific island small statesPakistanPalauPanamaPapua New GuineaParaguayPeruPhilippinesPolandPortugalPost-demographic dividendPre-demographic dividendPuerto RicoQatarRomaniaRussian FederationRwandaSamoaSaudi ArabiaSenegalSerbiaSeychellesSierra LeoneSingaporeSlovak RepublicSloveniaSmall statesSolomon IslandsSomaliaSouth AfricaSouth AsiaSouth Asia (IDA & IBRD)South SudanSpainSri LankaSt. Kitts and NevisSt. LuciaSt. Vincent and the GrenadinesSub-Saharan Africa Sub-Saharan Africa (excluding high income)Sub-Saharan Africa (IDA & IBRD countries)SudanSurinameSwazilandSwedenSwitzerlandSyrian Arab RepublicTajikistanTanzaniaThailandTimor-LesteTogoTongaTrinidad and TobagoTunisiaTurkeyTurkmenistanUgandaUkraineUnited Arab EmiratesUnited KingdomUnited StatesUpper middle incomeUruguayUzbekistanVanuatuVenezuela, RBVietnamWest Bank and GazaWorldYemen, Rep.ZambiaZimbabwe Timeline:
This timeline shows a graph from 1981 to 2016 of Namibia. No data until 1980. Number of actual observations by date: 36.
Source name:
World Development Indicators
Source organization:
World Bank national accounts data, and OECD National Accounts data files.
Categories, topics:
Economy & Growth, Trade
Last updated:
apr 23, 2017
Indicators value changes by year
Minimum:
39.928
jan 1, 1986
Maximum:
73.131
jan 1, 2010
At the date of observation
Value
Absolute change
Change from previous value
jan 1, 1981
55.979
+55.979
0.0%
jan 1, 1982
67.509
+11.53
20.6%
jan 1, 1983
60.661
-6.848
-10.14%
jan 1, 1984
52.408
-8.252
-13.6%
jan 1, 1985
51.299
-1.109
-2.12%
jan 1, 1986
39.928
-11.372
-22.17%
jan 1, 1987
45.996
+6.068
15.2%
jan 1, 1988
51.147
+5.152
11.2%
jan 1, 1989
44.549
-6.598
-12.9%
jan 1, 1990
46.287
+1.738
3.9%
jan 1, 1991
49.94
+3.653
7.89%
jan 1, 1992
49.605
-0.335
-0.67%
jan 1, 1993
48.692
-0.913
-1.84%
jan 1, 1994
49.996
+1.304
2.68%
jan 1, 1995
45.761
-4.235
-8.47%
jan 1, 1996
49.319
+3.558
7.77%
jan 1, 1997
51.708
+2.39
4.85%
jan 1, 1998
50.835
-0.873
-1.69%
jan 1, 1999
51.378
+0.543
1.07%
jan 1, 2000
50.315
-1.064
-2.07%
jan 1, 2001
44.55
-5.764
-11.46%
jan 1, 2002
47.67
+3.119
7.0%
jan 1, 2003
48.073
+0.404
0.85%
jan 1, 2004
52.471
+4.398
9.15%
jan 1, 2005
42.079
-10.392
-19.81%
jan 1, 2006
40.313
-1.767
-4.2%
jan 1, 2007
41.56
+1.247
3.09%
jan 1, 2008
55.818
+14.258
34.31%
jan 1, 2009
66.853
+11.036
19.77%
jan 1, 2010
73.131
+6.278
9.39%
jan 1, 2011
60.656
-12.475
-17.06%
jan 1, 2012
57.475
-3.181
-5.24%
jan 1, 2013
60.155
+2.68
4.66%
jan 1, 2014
58.496
-1.659
-2.76%
jan 1, 2015
62.684
+4.188
7.16%
jan 1, 2016
67.923
+5.238
8.36%
Ranking of countries by current statistics by years


Comments: