29
/
en
AIzaSyAYiBZKx7MnpbEhh9jyipgxe19OcubqV5w
April 1, 2024
135644
Gabon
GAB
true
2
1
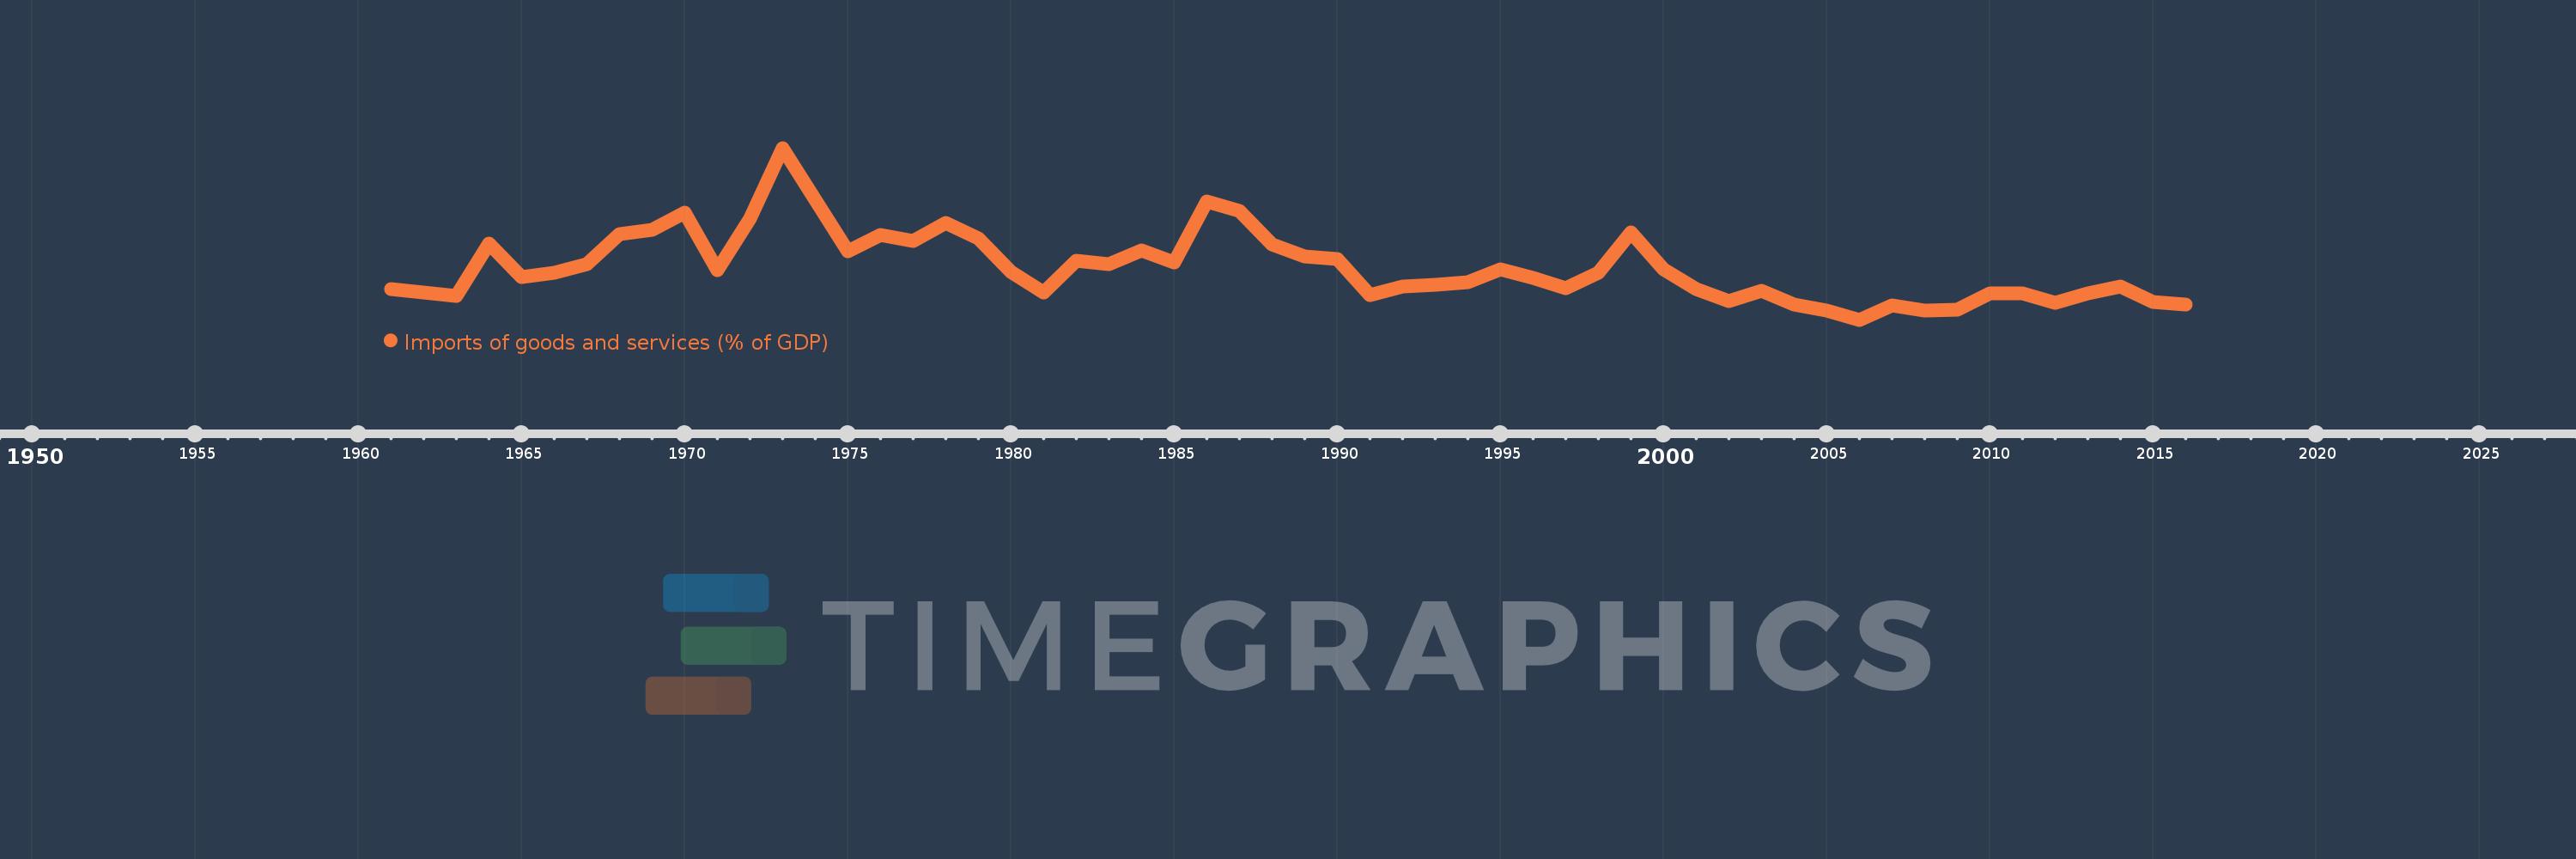
Imports of goods and services (% of GDP)
2016,2015,2014,2013,2012,2011,2010,2009,2008,2007,2006,2005,2004,2003,2002,2001,2000,1999,1998,1997,1996,1995,1994,1993,1992,1991,1990,1989,1988,1987,1986,1985,1984,1983,1982,1981,1980,1979,1978,1977,1976,1975,1974,1973,1972,1971,1970,1969,1968,1967,1966,1965,1964,1963,1962,1961
This statistics in other country:
AfghanistanAlbaniaAlgeriaAngolaAntigua and BarbudaArab WorldArgentinaArmeniaArubaAustraliaAustriaAzerbaijanBahamas, TheBahrainBangladeshBarbadosBelarusBelgiumBelizeBeninBermudaBhutanBoliviaBosnia and HerzegovinaBotswanaBrazilBrunei DarussalamBulgariaBurkina FasoBurundiCabo VerdeCambodiaCameroonCanadaCaribbean small statesCentral African RepublicCentral Europe and the BalticsChadChileChinaColombiaComorosCongo, Dem. Rep.Congo, Rep.Costa RicaCote d'IvoireCroatiaCubaCyprusCzech RepublicDenmarkDjiboutiDominicaDominican RepublicEarly-demographic dividendEast Asia & PacificEast Asia & Pacific (excluding high income)East Asia & Pacific (IDA & IBRD countries)EcuadorEgypt, Arab Rep.El SalvadorEquatorial GuineaEritreaEstoniaEthiopiaEuro areaEurope & Central AsiaEurope & Central Asia (excluding high income)Europe & Central Asia (IDA & IBRD countries)European UnionFaroe IslandsFijiFinlandFragile and conflict affected situationsFranceFrench PolynesiaGabonGambia, TheGeorgiaGermanyGhanaGreeceGrenadaGuatemalaGuineaGuinea-BissauGuyanaHaitiHeavily indebted poor countries (HIPC)High incomeHondurasHong Kong SAR, ChinaHungaryIBRD onlyIcelandIDA & IBRD totalIDA blendIDA onlyIDA totalIndiaIndonesiaIran, Islamic Rep.IraqIrelandIsraelItalyJamaicaJapanJordanKazakhstanKenyaKiribatiKorea, Rep.KosovoKuwaitKyrgyz RepublicLao PDRLate-demographic dividendLatin America & Caribbean Latin America & Caribbean (excluding high income)Latin America & the Caribbean (IDA & IBRD countries)LatviaLeast developed countries: UN classificationLebanonLesothoLiberiaLibyaLithuaniaLow & middle incomeLow incomeLower middle incomeLuxembourgMacao SAR, ChinaMacedonia, FYRMadagascarMalawiMalaysiaMaldivesMaliMaltaMauritaniaMauritiusMexicoMicronesia, Fed. Sts.Middle East & North AfricaMiddle East & North Africa (excluding high income)Middle East & North Africa (IDA & IBRD countries)Middle incomeMoldovaMongoliaMontenegroMoroccoMozambiqueMyanmarNamibiaNepalNetherlandsNew CaledoniaNew ZealandNicaraguaNigerNigeriaNorth AmericaNorwayOECD membersOmanOther small statesPacific island small statesPakistanPalauPanamaPapua New GuineaParaguayPeruPhilippinesPolandPortugalPost-demographic dividendPre-demographic dividendPuerto RicoQatarRomaniaRussian FederationRwandaSamoaSaudi ArabiaSenegalSerbiaSeychellesSierra LeoneSingaporeSlovak RepublicSloveniaSmall statesSolomon IslandsSomaliaSouth AfricaSouth AsiaSouth Asia (IDA & IBRD)South SudanSpainSri LankaSt. Kitts and NevisSt. LuciaSt. Vincent and the GrenadinesSub-Saharan Africa Sub-Saharan Africa (excluding high income)Sub-Saharan Africa (IDA & IBRD countries)SudanSurinameSwazilandSwedenSwitzerlandSyrian Arab RepublicTajikistanTanzaniaThailandTimor-LesteTogoTongaTrinidad and TobagoTunisiaTurkeyTurkmenistanUgandaUkraineUnited Arab EmiratesUnited KingdomUnited StatesUpper middle incomeUruguayUzbekistanVanuatuVenezuela, RBVietnamWest Bank and GazaWorldYemen, Rep.ZambiaZimbabwe Timeline:
This timeline shows a graph from 1961 to 2016 of Gabon. No data until 1960. Number of actual observations by date: 56.
Source name:
World Development Indicators
Source organization:
World Bank national accounts data, and OECD National Accounts data files.
Categories, topics:
Economy & Growth, Trade
Last updated:
apr 23, 2017
Indicators value changes by year
Minimum:
24.048
jan 1, 2006
Maximum:
72.258
jan 1, 1973
At the date of observation
Value
Absolute change
Change from previous value
jan 1, 1961
32.627
+32.627
0.0%
jan 1, 1962
31.663
-0.964
-2.96%
jan 1, 1963
30.768
-0.894
-2.82%
jan 1, 1964
45.394
+14.625
47.53%
jan 1, 1965
35.951
-9.442
-20.8%
jan 1, 1966
37.297
+1.346
3.74%
jan 1, 1967
39.57
+2.272
6.09%
jan 1, 1968
48.054
+8.484
21.44%
jan 1, 1969
49.246
+1.192
2.48%
jan 1, 1970
54.051
+4.805
9.76%
jan 1, 1971
37.989
-16.062
-29.72%
jan 1, 1972
52.331
+14.342
37.75%
jan 1, 1973
72.258
+19.927
38.08%
jan 1, 1974
57.666
-14.592
-20.19%
jan 1, 1975
43.261
-14.405
-24.98%
jan 1, 1976
47.902
+4.642
10.73%
jan 1, 1977
46.099
-1.803
-3.76%
jan 1, 1978
51.261
+5.161
11.2%
jan 1, 1979
46.921
-4.339
-8.46%
jan 1, 1980
37.403
-9.518
-20.29%
jan 1, 1981
31.63
-5.773
-15.43%
jan 1, 1982
40.696
+9.065
28.66%
jan 1, 1983
39.667
-1.029
-2.53%
jan 1, 1984
43.543
+3.876
9.77%
jan 1, 1985
40.2
-3.342
-7.68%
jan 1, 1986
57.281
+17.08
42.49%
jan 1, 1987
54.704
-2.577
-4.5%
jan 1, 1988
45.22
-9.485
-17.34%
jan 1, 1989
41.791
-3.428
-7.58%
jan 1, 1990
41.198
-0.593
-1.42%
jan 1, 1991
30.859
-10.339
-25.1%
jan 1, 1992
33.271
+2.413
7.82%
jan 1, 1993
33.793
+0.522
1.57%
jan 1, 1994
34.548
+0.755
2.23%
jan 1, 1995
38.251
+3.703
10.72%
jan 1, 1996
35.748
-2.503
-6.54%
jan 1, 1997
33.008
-2.74
-7.66%
jan 1, 1998
37.232
+4.225
12.8%
jan 1, 1999
48.568
+11.336
30.45%
jan 1, 2000
38.119
-10.449
-21.51%
jan 1, 2001
32.67
-5.449
-14.3%
jan 1, 2002
29.363
-3.306
-10.12%
jan 1, 2003
32.15
+2.787
9.49%
jan 1, 2004
28.373
-3.777
-11.75%
jan 1, 2005
26.728
-1.645
-5.8%
jan 1, 2006
24.048
-2.68
-10.03%
jan 1, 2007
28.167
+4.119
17.13%
jan 1, 2008
26.604
-1.563
-5.55%
jan 1, 2009
26.799
+0.195
0.73%
jan 1, 2010
31.333
+4.534
16.92%
jan 1, 2011
31.494
+0.161
0.51%
jan 1, 2012
28.754
-2.74
-8.7%
jan 1, 2013
31.392
+2.638
9.18%
jan 1, 2014
33.278
+1.885
6.01%
jan 1, 2015
28.999
-4.278
-12.86%
jan 1, 2016
28.261
-0.739
-2.55%
Ranking of countries by current statistics by years


Comments: