29
/
en
AIzaSyAYiBZKx7MnpbEhh9jyipgxe19OcubqV5w
April 1, 2024
223687
Philippines
PHL
true
2
1
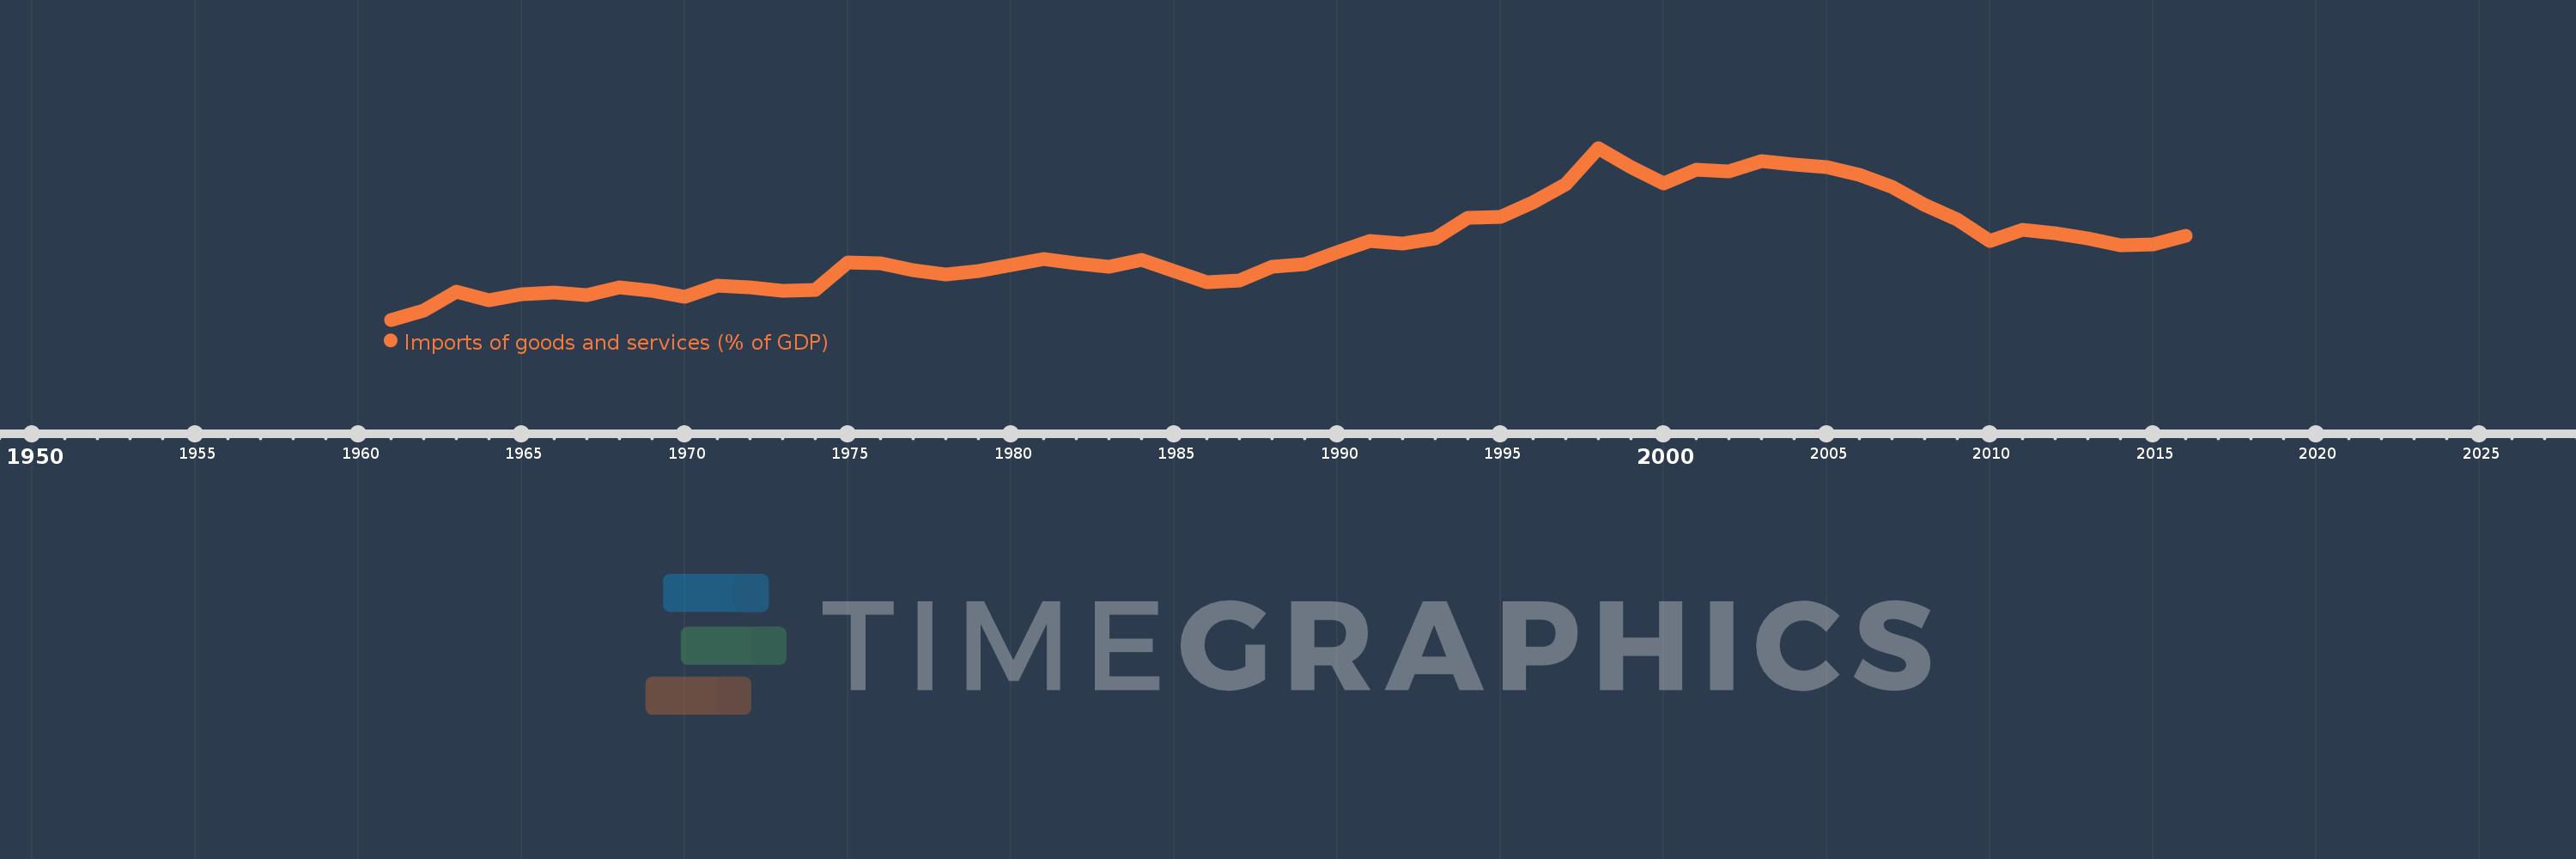
Imports of goods and services (% of GDP)
2016,2015,2014,2013,2012,2011,2010,2009,2008,2007,2006,2005,2004,2003,2002,2001,2000,1999,1998,1997,1996,1995,1994,1993,1992,1991,1990,1989,1988,1987,1986,1985,1984,1983,1982,1981,1980,1979,1978,1977,1976,1975,1974,1973,1972,1971,1970,1969,1968,1967,1966,1965,1964,1963,1962,1961
This statistics in other country:
AfghanistanAlbaniaAlgeriaAngolaAntigua and BarbudaArab WorldArgentinaArmeniaArubaAustraliaAustriaAzerbaijanBahamas, TheBahrainBangladeshBarbadosBelarusBelgiumBelizeBeninBermudaBhutanBoliviaBosnia and HerzegovinaBotswanaBrazilBrunei DarussalamBulgariaBurkina FasoBurundiCabo VerdeCambodiaCameroonCanadaCaribbean small statesCentral African RepublicCentral Europe and the BalticsChadChileChinaColombiaComorosCongo, Dem. Rep.Congo, Rep.Costa RicaCote d'IvoireCroatiaCubaCyprusCzech RepublicDenmarkDjiboutiDominicaDominican RepublicEarly-demographic dividendEast Asia & PacificEast Asia & Pacific (excluding high income)East Asia & Pacific (IDA & IBRD countries)EcuadorEgypt, Arab Rep.El SalvadorEquatorial GuineaEritreaEstoniaEthiopiaEuro areaEurope & Central AsiaEurope & Central Asia (excluding high income)Europe & Central Asia (IDA & IBRD countries)European UnionFaroe IslandsFijiFinlandFragile and conflict affected situationsFranceFrench PolynesiaGabonGambia, TheGeorgiaGermanyGhanaGreeceGrenadaGuatemalaGuineaGuinea-BissauGuyanaHaitiHeavily indebted poor countries (HIPC)High incomeHondurasHong Kong SAR, ChinaHungaryIBRD onlyIcelandIDA & IBRD totalIDA blendIDA onlyIDA totalIndiaIndonesiaIran, Islamic Rep.IraqIrelandIsraelItalyJamaicaJapanJordanKazakhstanKenyaKiribatiKorea, Rep.KosovoKuwaitKyrgyz RepublicLao PDRLate-demographic dividendLatin America & Caribbean Latin America & Caribbean (excluding high income)Latin America & the Caribbean (IDA & IBRD countries)LatviaLeast developed countries: UN classificationLebanonLesothoLiberiaLibyaLithuaniaLow & middle incomeLow incomeLower middle incomeLuxembourgMacao SAR, ChinaMacedonia, FYRMadagascarMalawiMalaysiaMaldivesMaliMaltaMauritaniaMauritiusMexicoMicronesia, Fed. Sts.Middle East & North AfricaMiddle East & North Africa (excluding high income)Middle East & North Africa (IDA & IBRD countries)Middle incomeMoldovaMongoliaMontenegroMoroccoMozambiqueMyanmarNamibiaNepalNetherlandsNew CaledoniaNew ZealandNicaraguaNigerNigeriaNorth AmericaNorwayOECD membersOmanOther small statesPacific island small statesPakistanPalauPanamaPapua New GuineaParaguayPeruPhilippinesPolandPortugalPost-demographic dividendPre-demographic dividendPuerto RicoQatarRomaniaRussian FederationRwandaSamoaSaudi ArabiaSenegalSerbiaSeychellesSierra LeoneSingaporeSlovak RepublicSloveniaSmall statesSolomon IslandsSomaliaSouth AfricaSouth AsiaSouth Asia (IDA & IBRD)South SudanSpainSri LankaSt. Kitts and NevisSt. LuciaSt. Vincent and the GrenadinesSub-Saharan Africa Sub-Saharan Africa (excluding high income)Sub-Saharan Africa (IDA & IBRD countries)SudanSurinameSwazilandSwedenSwitzerlandSyrian Arab RepublicTajikistanTanzaniaThailandTimor-LesteTogoTongaTrinidad and TobagoTunisiaTurkeyTurkmenistanUgandaUkraineUnited Arab EmiratesUnited KingdomUnited StatesUpper middle incomeUruguayUzbekistanVanuatuVenezuela, RBVietnamWest Bank and GazaWorldYemen, Rep.ZambiaZimbabwe Timeline:
This timeline shows a graph from 1961 to 2016 of Philippines. No data until 1960. Number of actual observations by date: 56.
Source name:
World Development Indicators
Source organization:
World Bank national accounts data, and OECD National Accounts data files.
Categories, topics:
Economy & Growth, Trade
Last updated:
apr 23, 2017
Indicators value changes by year
Minimum:
11.475
jan 1, 1961
Maximum:
59.294
jan 1, 1998
At the date of observation
Value
Absolute change
Change from previous value
jan 1, 1961
11.475
+11.475
0.0%
jan 1, 1962
14.025
+2.55
22.22%
jan 1, 1963
19.235
+5.21
37.15%
jan 1, 1964
16.954
-2.281
-11.86%
jan 1, 1965
18.491
+1.537
9.07%
jan 1, 1966
18.959
+0.468
2.53%
jan 1, 1967
18.301
-0.658
-3.47%
jan 1, 1968
20.605
+2.304
12.59%
jan 1, 1969
19.491
-1.114
-5.41%
jan 1, 1970
17.776
-1.715
-8.8%
jan 1, 1971
21.045
+3.269
18.39%
jan 1, 1972
20.414
-0.631
-3.0%
jan 1, 1973
19.469
-0.945
-4.63%
jan 1, 1974
19.889
+0.42
2.16%
jan 1, 1975
27.353
+7.464
37.53%
jan 1, 1976
27.11
-0.243
-0.89%
jan 1, 1977
25.249
-1.861
-6.87%
jan 1, 1978
24.126
-1.123
-4.45%
jan 1, 1979
24.937
+0.811
3.36%
jan 1, 1980
26.637
+1.7
6.82%
jan 1, 1981
28.471
+1.834
6.89%
jan 1, 1982
27.172
-1.3
-4.56%
jan 1, 1983
26.136
-1.036
-3.81%
jan 1, 1984
28.081
+1.945
7.44%
jan 1, 1985
25.073
-3.008
-10.71%
jan 1, 1986
21.893
-3.18
-12.68%
jan 1, 1987
22.374
+0.481
2.2%
jan 1, 1988
26.221
+3.847
17.19%
jan 1, 1989
26.939
+0.718
2.74%
jan 1, 1990
30.268
+3.329
12.36%
jan 1, 1991
33.284
+3.016
9.96%
jan 1, 1992
32.588
-0.696
-2.09%
jan 1, 1993
34.028
+1.44
4.42%
jan 1, 1994
39.807
+5.779
16.98%
jan 1, 1995
40.134
+0.327
0.82%
jan 1, 1996
44.181
+4.047
10.08%
jan 1, 1997
49.293
+5.112
11.57%
jan 1, 1998
59.294
+10.001
20.29%
jan 1, 1999
53.898
-5.396
-9.1%
jan 1, 2000
49.42
-4.478
-8.31%
jan 1, 2001
53.361
+3.94
7.97%
jan 1, 2002
52.882
-0.478
-0.9%
jan 1, 2003
55.688
+2.806
5.31%
jan 1, 2004
54.692
-0.996
-1.79%
jan 1, 2005
54.07
-0.622
-1.14%
jan 1, 2006
51.742
-2.328
-4.31%
jan 1, 2007
48.363
-3.379
-6.53%
jan 1, 2008
43.359
-5.004
-10.35%
jan 1, 2009
39.37
-3.988
-9.2%
jan 1, 2010
33.358
-6.012
-15.27%
jan 1, 2011
36.616
+3.258
9.77%
jan 1, 2012
35.667
-0.949
-2.59%
jan 1, 2013
34.08
-1.587
-4.45%
jan 1, 2014
32.228
-1.853
-5.44%
jan 1, 2015
32.419
+0.191
0.59%
jan 1, 2016
34.846
+2.427
7.49%
Ranking of countries by current statistics by years


Comments: