29
/
en
AIzaSyAYiBZKx7MnpbEhh9jyipgxe19OcubqV5w
April 1, 2024
124924
Egypt, Arab Rep.
EGY
true
2
1
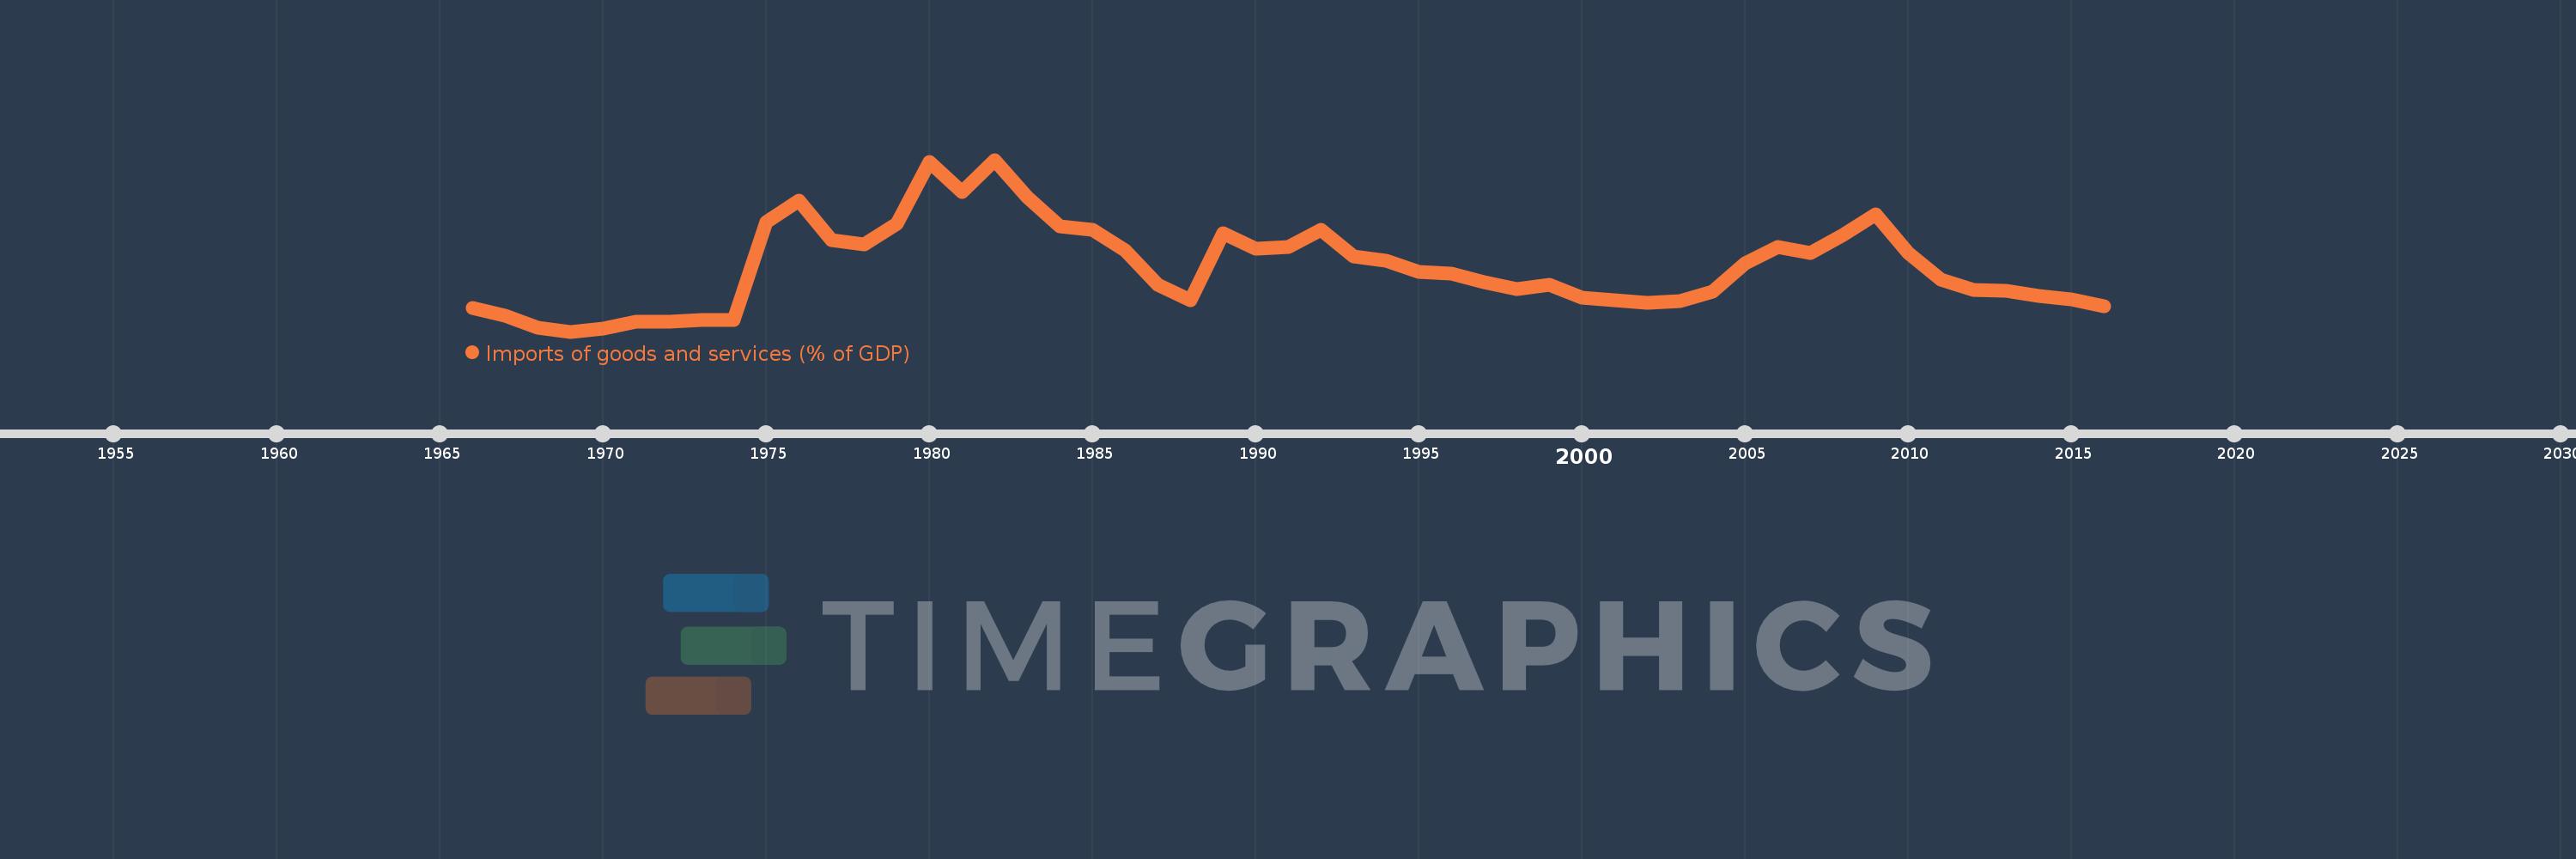
Imports of goods and services (% of GDP)
2016,2015,2014,2013,2012,2011,2010,2009,2008,2007,2006,2005,2004,2003,2002,2001,2000,1999,1998,1997,1996,1995,1994,1993,1992,1991,1990,1989,1988,1987,1986,1985,1984,1983,1982,1981,1980,1979,1978,1977,1976,1975,1974,1973,1972,1971,1970,1969,1968,1967,1966
This statistics in other country:
AfghanistanAlbaniaAlgeriaAngolaAntigua and BarbudaArab WorldArgentinaArmeniaArubaAustraliaAustriaAzerbaijanBahamas, TheBahrainBangladeshBarbadosBelarusBelgiumBelizeBeninBermudaBhutanBoliviaBosnia and HerzegovinaBotswanaBrazilBrunei DarussalamBulgariaBurkina FasoBurundiCabo VerdeCambodiaCameroonCanadaCaribbean small statesCentral African RepublicCentral Europe and the BalticsChadChileChinaColombiaComorosCongo, Dem. Rep.Congo, Rep.Costa RicaCote d'IvoireCroatiaCubaCyprusCzech RepublicDenmarkDjiboutiDominicaDominican RepublicEarly-demographic dividendEast Asia & PacificEast Asia & Pacific (excluding high income)East Asia & Pacific (IDA & IBRD countries)EcuadorEgypt, Arab Rep.El SalvadorEquatorial GuineaEritreaEstoniaEthiopiaEuro areaEurope & Central AsiaEurope & Central Asia (excluding high income)Europe & Central Asia (IDA & IBRD countries)European UnionFaroe IslandsFijiFinlandFragile and conflict affected situationsFranceFrench PolynesiaGabonGambia, TheGeorgiaGermanyGhanaGreeceGrenadaGuatemalaGuineaGuinea-BissauGuyanaHaitiHeavily indebted poor countries (HIPC)High incomeHondurasHong Kong SAR, ChinaHungaryIBRD onlyIcelandIDA & IBRD totalIDA blendIDA onlyIDA totalIndiaIndonesiaIran, Islamic Rep.IraqIrelandIsraelItalyJamaicaJapanJordanKazakhstanKenyaKiribatiKorea, Rep.KosovoKuwaitKyrgyz RepublicLao PDRLate-demographic dividendLatin America & Caribbean Latin America & Caribbean (excluding high income)Latin America & the Caribbean (IDA & IBRD countries)LatviaLeast developed countries: UN classificationLebanonLesothoLiberiaLibyaLithuaniaLow & middle incomeLow incomeLower middle incomeLuxembourgMacao SAR, ChinaMacedonia, FYRMadagascarMalawiMalaysiaMaldivesMaliMaltaMauritaniaMauritiusMexicoMicronesia, Fed. Sts.Middle East & North AfricaMiddle East & North Africa (excluding high income)Middle East & North Africa (IDA & IBRD countries)Middle incomeMoldovaMongoliaMontenegroMoroccoMozambiqueMyanmarNamibiaNepalNetherlandsNew CaledoniaNew ZealandNicaraguaNigerNigeriaNorth AmericaNorwayOECD membersOmanOther small statesPacific island small statesPakistanPalauPanamaPapua New GuineaParaguayPeruPhilippinesPolandPortugalPost-demographic dividendPre-demographic dividendPuerto RicoQatarRomaniaRussian FederationRwandaSamoaSaudi ArabiaSenegalSerbiaSeychellesSierra LeoneSingaporeSlovak RepublicSloveniaSmall statesSolomon IslandsSomaliaSouth AfricaSouth AsiaSouth Asia (IDA & IBRD)South SudanSpainSri LankaSt. Kitts and NevisSt. LuciaSt. Vincent and the GrenadinesSub-Saharan Africa Sub-Saharan Africa (excluding high income)Sub-Saharan Africa (IDA & IBRD countries)SudanSurinameSwazilandSwedenSwitzerlandSyrian Arab RepublicTajikistanTanzaniaThailandTimor-LesteTogoTongaTrinidad and TobagoTunisiaTurkeyTurkmenistanUgandaUkraineUnited Arab EmiratesUnited KingdomUnited StatesUpper middle incomeUruguayUzbekistanVanuatuVenezuela, RBVietnamWest Bank and GazaWorldYemen, Rep.ZambiaZimbabwe Timeline:
This timeline shows a graph from 1966 to 2016 of Egypt, Arab Rep.. No data until 1965. Number of actual observations by date: 51.
Source name:
World Development Indicators
Source organization:
World Bank national accounts data, and OECD National Accounts data files.
Categories, topics:
Economy & Growth, Trade
Last updated:
apr 23, 2017
Indicators value changes by year
Maximum:
48.805
jan 1, 1982
At the date of observation
Value
Absolute change
Change from previous value
jan 1, 1966
21.345
+21.345
0.0%
jan 1, 1967
19.897
-1.449
-6.79%
jan 1, 1968
17.761
-2.135
-10.73%
jan 1, 1969
17.0
-0.761
-4.29%
jan 1, 1970
17.513
+0.513
3.02%
jan 1, 1971
18.752
+1.239
7.07%
jan 1, 1972
18.892
+0.14
0.75%
jan 1, 1973
19.133
+0.242
1.28%
jan 1, 1974
19.16
+0.027
0.14%
jan 1, 1975
37.244
+18.083
94.38%
jan 1, 1976
41.28
+4.037
10.84%
jan 1, 1977
33.997
-7.283
-17.64%
jan 1, 1978
33.198
-0.8
-2.35%
jan 1, 1979
37.019
+3.821
11.51%
jan 1, 1980
48.335
+11.316
30.57%
jan 1, 1981
42.866
-5.469
-11.32%
jan 1, 1982
48.805
+5.939
13.85%
jan 1, 1983
41.933
-6.872
-14.08%
jan 1, 1984
36.429
-5.503
-13.12%
jan 1, 1985
35.813
-0.617
-1.69%
jan 1, 1986
32.042
-3.771
-10.53%
jan 1, 1987
25.594
-6.447
-20.12%
jan 1, 1988
22.766
-2.828
-11.05%
jan 1, 1989
35.161
+12.395
54.44%
jan 1, 1990
32.351
-2.81
-7.99%
jan 1, 1991
32.713
+0.362
1.12%
jan 1, 1992
35.796
+3.082
9.42%
jan 1, 1993
30.913
-4.883
-13.64%
jan 1, 1994
30.09
-0.823
-2.66%
jan 1, 1995
28.057
-2.033
-6.76%
jan 1, 1996
27.696
-0.361
-1.29%
jan 1, 1997
26.199
-1.497
-5.41%
jan 1, 1998
24.897
-1.302
-4.97%
jan 1, 1999
25.713
+0.817
3.28%
jan 1, 2000
23.309
-2.404
-9.35%
jan 1, 2001
22.817
-0.493
-2.11%
jan 1, 2002
22.331
-0.486
-2.13%
jan 1, 2003
22.671
+0.34
1.52%
jan 1, 2004
24.383
+1.712
7.55%
jan 1, 2005
29.59
+5.207
21.35%
jan 1, 2006
32.609
+3.019
10.2%
jan 1, 2007
31.569
-1.04
-3.19%
jan 1, 2008
34.828
+3.259
10.32%
jan 1, 2009
38.638
+3.809
10.94%
jan 1, 2010
31.597
-7.041
-18.22%
jan 1, 2011
26.587
-5.01
-15.85%
jan 1, 2012
24.688
-1.899
-7.14%
jan 1, 2013
24.58
-0.108
-0.44%
jan 1, 2014
23.565
-1.015
-4.13%
jan 1, 2015
22.979
-0.586
-2.49%
jan 1, 2016
21.648
-1.331
-5.79%
Ranking of countries by current statistics by years


Comments: