29
/
en
AIzaSyAYiBZKx7MnpbEhh9jyipgxe19OcubqV5w
April 1, 2024
45173
Low & middle income
LMY
false
2
1
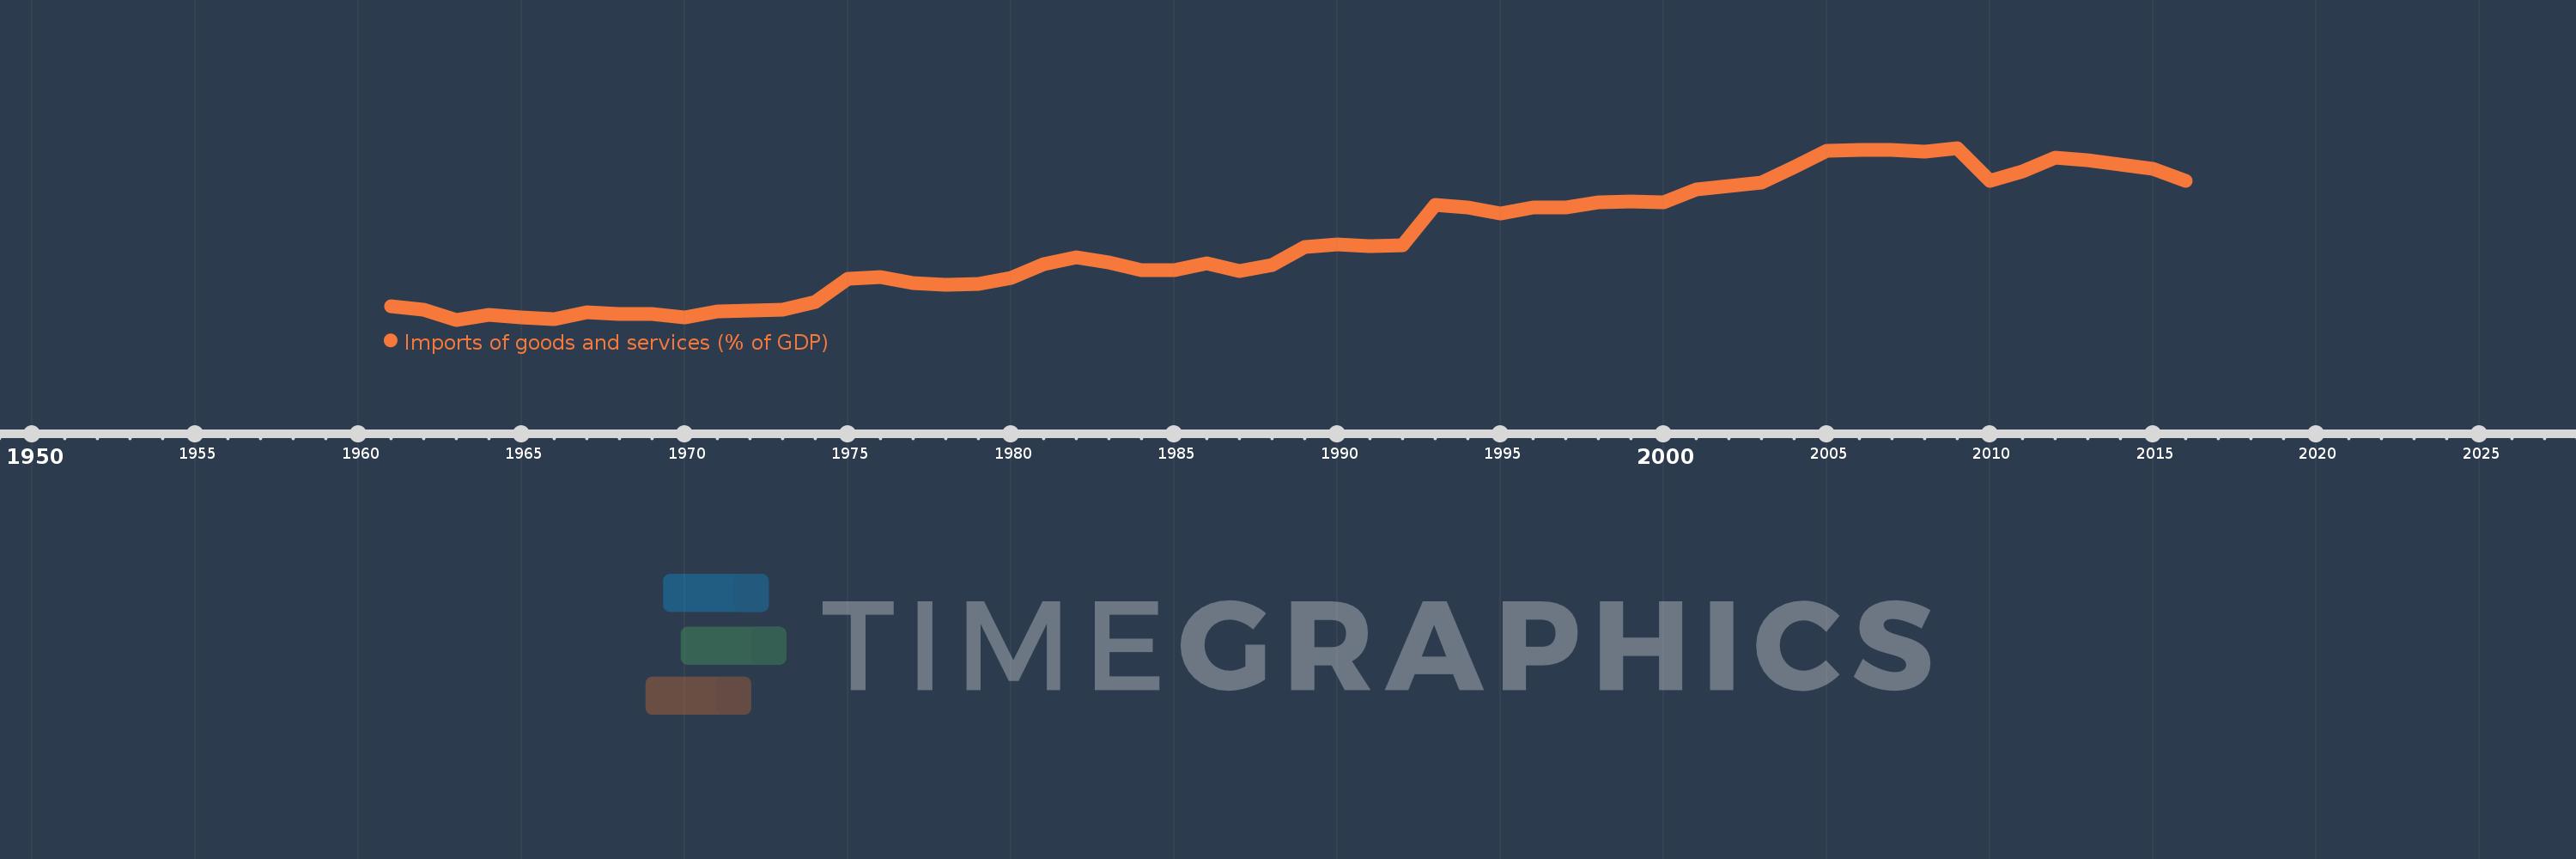
Imports of goods and services (% of GDP)
2016,2015,2014,2013,2012,2011,2010,2009,2008,2007,2006,2005,2004,2003,2002,2001,2000,1999,1998,1997,1996,1995,1994,1993,1992,1991,1990,1989,1988,1987,1986,1985,1984,1983,1982,1981,1980,1979,1978,1977,1976,1975,1974,1973,1972,1971,1970,1969,1968,1967,1966,1965,1964,1963,1962,1961
This statistics in other country:
AfghanistanAlbaniaAlgeriaAngolaAntigua and BarbudaArab WorldArgentinaArmeniaArubaAustraliaAustriaAzerbaijanBahamas, TheBahrainBangladeshBarbadosBelarusBelgiumBelizeBeninBermudaBhutanBoliviaBosnia and HerzegovinaBotswanaBrazilBrunei DarussalamBulgariaBurkina FasoBurundiCabo VerdeCambodiaCameroonCanadaCaribbean small statesCentral African RepublicCentral Europe and the BalticsChadChileChinaColombiaComorosCongo, Dem. Rep.Congo, Rep.Costa RicaCote d'IvoireCroatiaCubaCyprusCzech RepublicDenmarkDjiboutiDominicaDominican RepublicEarly-demographic dividendEast Asia & PacificEast Asia & Pacific (excluding high income)East Asia & Pacific (IDA & IBRD countries)EcuadorEgypt, Arab Rep.El SalvadorEquatorial GuineaEritreaEstoniaEthiopiaEuro areaEurope & Central AsiaEurope & Central Asia (excluding high income)Europe & Central Asia (IDA & IBRD countries)European UnionFaroe IslandsFijiFinlandFragile and conflict affected situationsFranceFrench PolynesiaGabonGambia, TheGeorgiaGermanyGhanaGreeceGrenadaGuatemalaGuineaGuinea-BissauGuyanaHaitiHeavily indebted poor countries (HIPC)High incomeHondurasHong Kong SAR, ChinaHungaryIBRD onlyIcelandIDA & IBRD totalIDA blendIDA onlyIDA totalIndiaIndonesiaIran, Islamic Rep.IraqIrelandIsraelItalyJamaicaJapanJordanKazakhstanKenyaKiribatiKorea, Rep.KosovoKuwaitKyrgyz RepublicLao PDRLate-demographic dividendLatin America & Caribbean Latin America & Caribbean (excluding high income)Latin America & the Caribbean (IDA & IBRD countries)LatviaLeast developed countries: UN classificationLebanonLesothoLiberiaLibyaLithuaniaLow & middle incomeLow incomeLower middle incomeLuxembourgMacao SAR, ChinaMacedonia, FYRMadagascarMalawiMalaysiaMaldivesMaliMaltaMauritaniaMauritiusMexicoMicronesia, Fed. Sts.Middle East & North AfricaMiddle East & North Africa (excluding high income)Middle East & North Africa (IDA & IBRD countries)Middle incomeMoldovaMongoliaMontenegroMoroccoMozambiqueMyanmarNamibiaNepalNetherlandsNew CaledoniaNew ZealandNicaraguaNigerNigeriaNorth AmericaNorwayOECD membersOmanOther small statesPacific island small statesPakistanPalauPanamaPapua New GuineaParaguayPeruPhilippinesPolandPortugalPost-demographic dividendPre-demographic dividendPuerto RicoQatarRomaniaRussian FederationRwandaSamoaSaudi ArabiaSenegalSerbiaSeychellesSierra LeoneSingaporeSlovak RepublicSloveniaSmall statesSolomon IslandsSomaliaSouth AfricaSouth AsiaSouth Asia (IDA & IBRD)South SudanSpainSri LankaSt. Kitts and NevisSt. LuciaSt. Vincent and the GrenadinesSub-Saharan Africa Sub-Saharan Africa (excluding high income)Sub-Saharan Africa (IDA & IBRD countries)SudanSurinameSwazilandSwedenSwitzerlandSyrian Arab RepublicTajikistanTanzaniaThailandTimor-LesteTogoTongaTrinidad and TobagoTunisiaTurkeyTurkmenistanUgandaUkraineUnited Arab EmiratesUnited KingdomUnited StatesUpper middle incomeUruguayUzbekistanVanuatuVenezuela, RBVietnamWest Bank and GazaWorldYemen, Rep.ZambiaZimbabwe Timeline:
This timeline shows a graph from 1961 to 2016 of Low & middle income. No data until 1960. Number of actual observations by date: 56.
Source name:
World Development Indicators
Source organization:
World Bank national accounts data, and OECD National Accounts data files.
Categories, topics:
Economy & Growth, Trade
Last updated:
apr 23, 2017
Indicators value changes by year
Maximum:
28.791
jan 1, 2009
At the date of observation
Value
Absolute change
Change from previous value
jan 1, 1961
10.17
+10.17
0.0%
jan 1, 1962
9.78
-0.39
-3.83%
jan 1, 1963
8.583
-1.198
-12.24%
jan 1, 1964
9.148
+0.565
6.59%
jan 1, 1965
8.88
-0.268
-2.93%
jan 1, 1966
8.693
-0.186
-2.1%
jan 1, 1967
9.491
+0.798
9.17%
jan 1, 1968
9.242
-0.249
-2.63%
jan 1, 1969
9.244
+0.002
0.03%
jan 1, 1970
8.886
-0.358
-3.87%
jan 1, 1971
9.541
+0.655
7.37%
jan 1, 1972
9.668
+0.127
1.33%
jan 1, 1973
9.761
+0.093
0.96%
jan 1, 1974
10.636
+0.875
8.96%
jan 1, 1975
13.435
+2.799
26.32%
jan 1, 1976
13.644
+0.21
1.56%
jan 1, 1977
12.857
-0.787
-5.77%
jan 1, 1978
12.729
-0.129
-1.0%
jan 1, 1979
12.756
+0.028
0.22%
jan 1, 1980
13.505
+0.749
5.87%
jan 1, 1981
15.07
+1.565
11.59%
jan 1, 1982
15.941
+0.871
5.78%
jan 1, 1983
15.354
-0.587
-3.68%
jan 1, 1984
14.46
-0.895
-5.83%
jan 1, 1985
14.364
-0.096
-0.66%
jan 1, 1986
15.183
+0.818
5.7%
jan 1, 1987
14.312
-0.87
-5.73%
jan 1, 1988
15.052
+0.739
5.17%
jan 1, 1989
17.17
+2.118
14.07%
jan 1, 1990
17.428
+0.258
1.5%
jan 1, 1991
17.284
-0.144
-0.82%
jan 1, 1992
17.392
+0.107
0.62%
jan 1, 1993
22.068
+4.676
26.89%
jan 1, 1994
21.811
-0.257
-1.16%
jan 1, 1995
21.057
-0.754
-3.46%
jan 1, 1996
21.798
+0.741
3.52%
jan 1, 1997
21.76
-0.039
-0.18%
jan 1, 1998
22.369
+0.61
2.8%
jan 1, 1999
22.513
+0.144
0.64%
jan 1, 2000
22.36
-0.153
-0.68%
jan 1, 2001
23.937
+1.576
7.05%
jan 1, 2002
24.325
+0.388
1.62%
jan 1, 2003
24.755
+0.43
1.77%
jan 1, 2004
26.583
+1.827
7.38%
jan 1, 2005
28.505
+1.922
7.23%
jan 1, 2006
28.583
+0.078
0.27%
jan 1, 2007
28.513
-0.07
-0.24%
jan 1, 2008
28.345
-0.168
-0.59%
jan 1, 2009
28.791
+0.445
1.57%
jan 1, 2010
24.881
-3.91
-13.58%
jan 1, 2011
26.038
+1.158
4.65%
jan 1, 2012
27.61
+1.571
6.04%
jan 1, 2013
27.391
-0.218
-0.79%
jan 1, 2014
26.805
-0.586
-2.14%
jan 1, 2015
26.357
-0.448
-1.67%
jan 1, 2016
24.913
-1.445
-5.48%
Ranking of countries by current statistics by years


Comments: