29
/
en
AIzaSyAYiBZKx7MnpbEhh9jyipgxe19OcubqV5w
April 1, 2024
87355
Bolivia
BOL
true
2
1
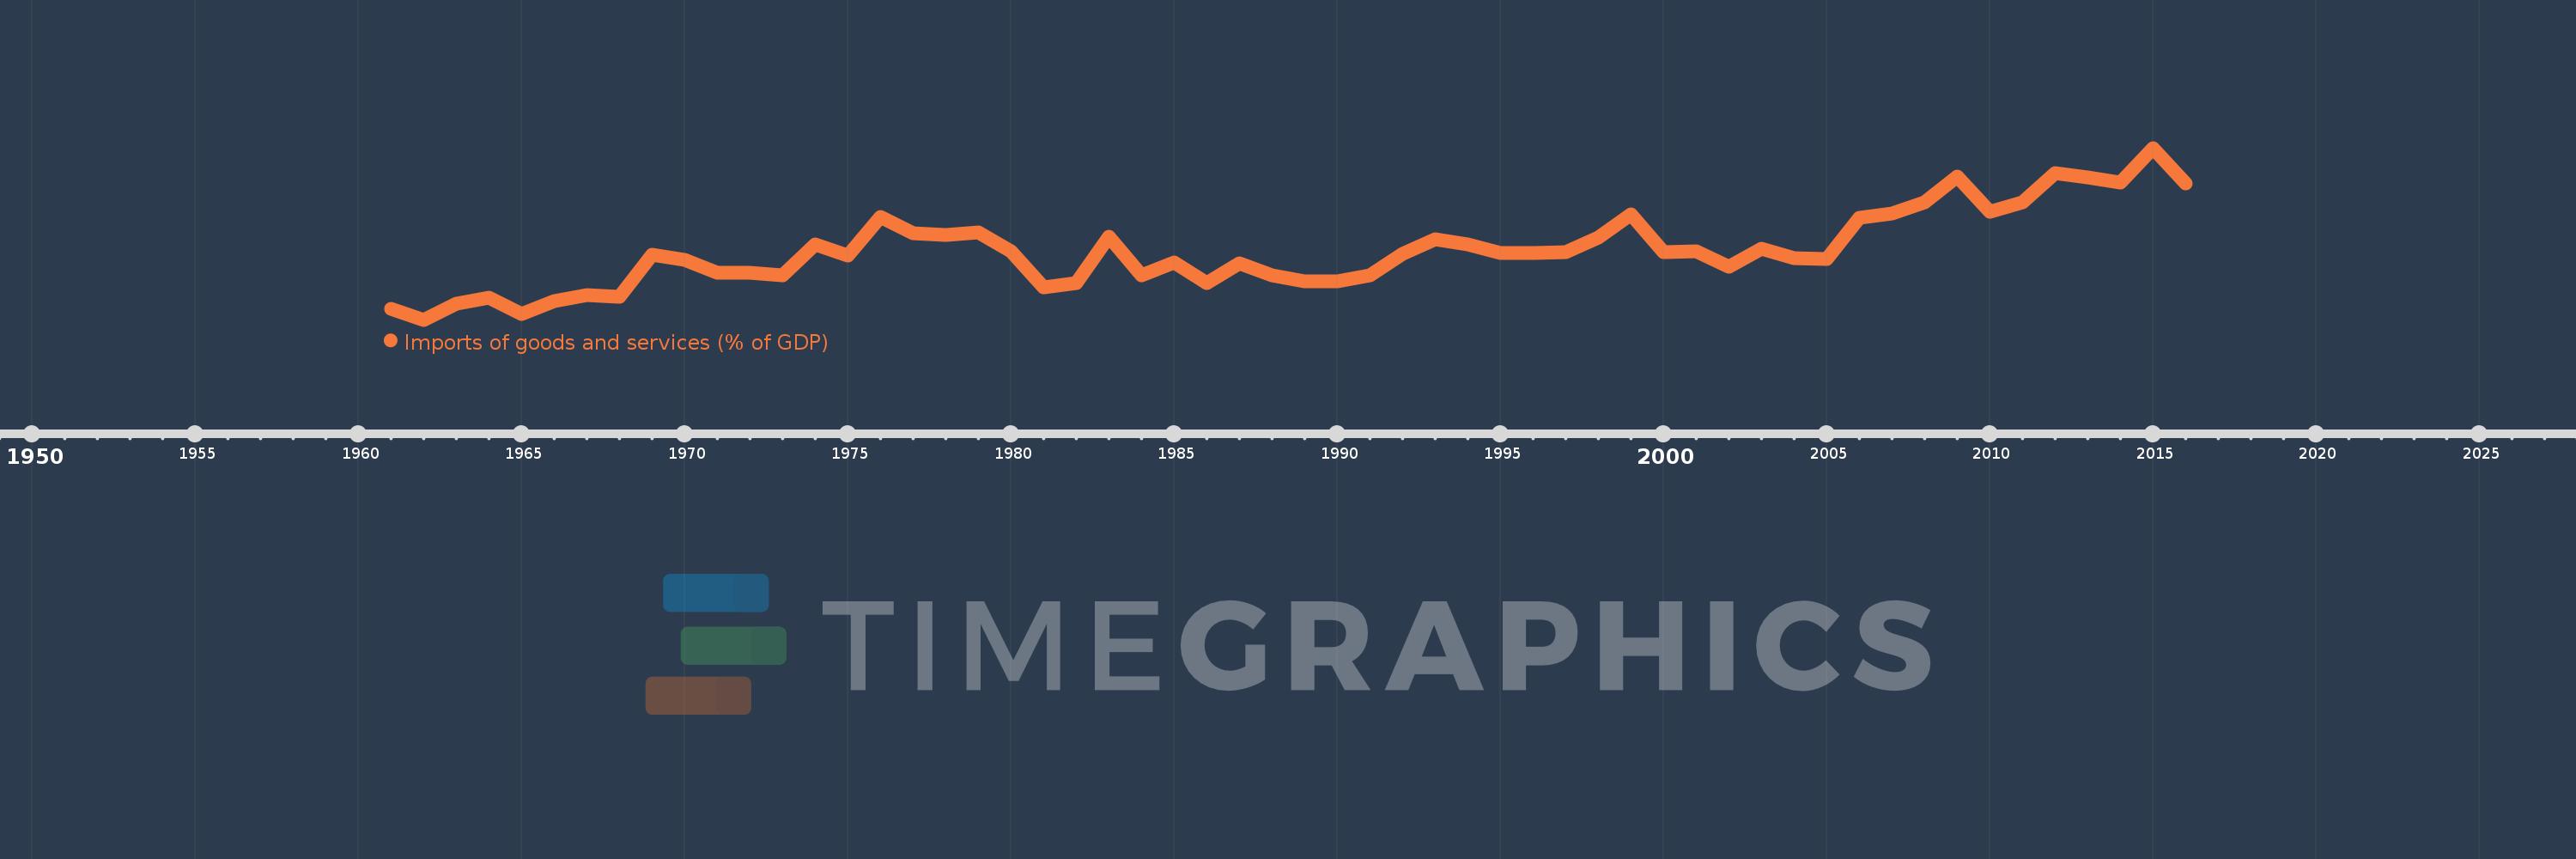
Imports of goods and services (% of GDP)
2016,2015,2014,2013,2012,2011,2010,2009,2008,2007,2006,2005,2004,2003,2002,2001,2000,1999,1998,1997,1996,1995,1994,1993,1992,1991,1990,1989,1988,1987,1986,1985,1984,1983,1982,1981,1980,1979,1978,1977,1976,1975,1974,1973,1972,1971,1970,1969,1968,1967,1966,1965,1964,1963,1962,1961
This statistics in other country:
AfghanistanAlbaniaAlgeriaAngolaAntigua and BarbudaArab WorldArgentinaArmeniaArubaAustraliaAustriaAzerbaijanBahamas, TheBahrainBangladeshBarbadosBelarusBelgiumBelizeBeninBermudaBhutanBoliviaBosnia and HerzegovinaBotswanaBrazilBrunei DarussalamBulgariaBurkina FasoBurundiCabo VerdeCambodiaCameroonCanadaCaribbean small statesCentral African RepublicCentral Europe and the BalticsChadChileChinaColombiaComorosCongo, Dem. Rep.Congo, Rep.Costa RicaCote d'IvoireCroatiaCubaCyprusCzech RepublicDenmarkDjiboutiDominicaDominican RepublicEarly-demographic dividendEast Asia & PacificEast Asia & Pacific (excluding high income)East Asia & Pacific (IDA & IBRD countries)EcuadorEgypt, Arab Rep.El SalvadorEquatorial GuineaEritreaEstoniaEthiopiaEuro areaEurope & Central AsiaEurope & Central Asia (excluding high income)Europe & Central Asia (IDA & IBRD countries)European UnionFaroe IslandsFijiFinlandFragile and conflict affected situationsFranceFrench PolynesiaGabonGambia, TheGeorgiaGermanyGhanaGreeceGrenadaGuatemalaGuineaGuinea-BissauGuyanaHaitiHeavily indebted poor countries (HIPC)High incomeHondurasHong Kong SAR, ChinaHungaryIBRD onlyIcelandIDA & IBRD totalIDA blendIDA onlyIDA totalIndiaIndonesiaIran, Islamic Rep.IraqIrelandIsraelItalyJamaicaJapanJordanKazakhstanKenyaKiribatiKorea, Rep.KosovoKuwaitKyrgyz RepublicLao PDRLate-demographic dividendLatin America & Caribbean Latin America & Caribbean (excluding high income)Latin America & the Caribbean (IDA & IBRD countries)LatviaLeast developed countries: UN classificationLebanonLesothoLiberiaLibyaLithuaniaLow & middle incomeLow incomeLower middle incomeLuxembourgMacao SAR, ChinaMacedonia, FYRMadagascarMalawiMalaysiaMaldivesMaliMaltaMauritaniaMauritiusMexicoMicronesia, Fed. Sts.Middle East & North AfricaMiddle East & North Africa (excluding high income)Middle East & North Africa (IDA & IBRD countries)Middle incomeMoldovaMongoliaMontenegroMoroccoMozambiqueMyanmarNamibiaNepalNetherlandsNew CaledoniaNew ZealandNicaraguaNigerNigeriaNorth AmericaNorwayOECD membersOmanOther small statesPacific island small statesPakistanPalauPanamaPapua New GuineaParaguayPeruPhilippinesPolandPortugalPost-demographic dividendPre-demographic dividendPuerto RicoQatarRomaniaRussian FederationRwandaSamoaSaudi ArabiaSenegalSerbiaSeychellesSierra LeoneSingaporeSlovak RepublicSloveniaSmall statesSolomon IslandsSomaliaSouth AfricaSouth AsiaSouth Asia (IDA & IBRD)South SudanSpainSri LankaSt. Kitts and NevisSt. LuciaSt. Vincent and the GrenadinesSub-Saharan Africa Sub-Saharan Africa (excluding high income)Sub-Saharan Africa (IDA & IBRD countries)SudanSurinameSwazilandSwedenSwitzerlandSyrian Arab RepublicTajikistanTanzaniaThailandTimor-LesteTogoTongaTrinidad and TobagoTunisiaTurkeyTurkmenistanUgandaUkraineUnited Arab EmiratesUnited KingdomUnited StatesUpper middle incomeUruguayUzbekistanVanuatuVenezuela, RBVietnamWest Bank and GazaWorldYemen, Rep.ZambiaZimbabwe Timeline:
This timeline shows a graph from 1961 to 2016 of Bolivia. No data until 1960. Number of actual observations by date: 56.
Source name:
World Development Indicators
Source organization:
World Bank national accounts data, and OECD National Accounts data files.
Categories, topics:
Economy & Growth, Trade
Last updated:
apr 23, 2017
Indicators value changes by year
Minimum:
17.716
jan 1, 1962
Maximum:
41.971
jan 1, 2015
At the date of observation
Value
Absolute change
Change from previous value
jan 1, 1961
19.271
+19.271
0.0%
jan 1, 1962
17.716
-1.554
-8.07%
jan 1, 1963
19.942
+2.226
12.56%
jan 1, 1964
20.835
+0.893
4.48%
jan 1, 1965
18.492
-2.344
-11.25%
jan 1, 1966
20.375
+1.884
10.19%
jan 1, 1967
21.17
+0.795
3.9%
jan 1, 1968
20.965
-0.205
-0.97%
jan 1, 1969
26.858
+5.893
28.11%
jan 1, 1970
26.179
-0.679
-2.53%
jan 1, 1971
24.355
-1.824
-6.97%
jan 1, 1972
24.404
+0.05
0.21%
jan 1, 1973
24.019
-0.385
-1.58%
jan 1, 1974
28.319
+4.3
17.9%
jan 1, 1975
26.798
-1.521
-5.37%
jan 1, 1976
32.217
+5.419
20.22%
jan 1, 1977
29.885
-2.331
-7.24%
jan 1, 1978
29.646
-0.239
-0.8%
jan 1, 1979
30.108
+0.462
1.56%
jan 1, 1980
27.396
-2.712
-9.01%
jan 1, 1981
22.285
-5.111
-18.65%
jan 1, 1982
22.954
+0.668
3.0%
jan 1, 1983
29.404
+6.45
28.1%
jan 1, 1984
24.039
-5.365
-18.25%
jan 1, 1985
25.82
+1.781
7.41%
jan 1, 1986
22.843
-2.977
-11.53%
jan 1, 1987
25.707
+2.864
12.54%
jan 1, 1988
23.992
-1.715
-6.67%
jan 1, 1989
23.139
-0.853
-3.56%
jan 1, 1990
23.156
+0.018
0.08%
jan 1, 1991
23.926
+0.77
3.32%
jan 1, 1992
26.966
+3.039
12.7%
jan 1, 1993
29.065
+2.099
7.79%
jan 1, 1994
28.386
-0.679
-2.34%
jan 1, 1995
27.198
-1.189
-4.19%
jan 1, 1996
27.187
-0.011
-0.04%
jan 1, 1997
27.274
+0.088
0.32%
jan 1, 1998
29.359
+2.085
7.64%
jan 1, 1999
32.582
+3.223
10.98%
jan 1, 2000
27.287
-5.295
-16.25%
jan 1, 2001
27.323
+0.036
0.13%
jan 1, 2002
25.256
-2.067
-7.57%
jan 1, 2003
27.716
+2.46
9.74%
jan 1, 2004
26.367
-1.349
-4.87%
jan 1, 2005
26.326
-0.041
-0.16%
jan 1, 2006
32.094
+5.768
21.91%
jan 1, 2007
32.766
+0.672
2.09%
jan 1, 2008
34.266
+1.5
4.58%
jan 1, 2009
37.96
+3.695
10.78%
jan 1, 2010
32.905
-5.056
-13.32%
jan 1, 2011
34.324
+1.42
4.31%
jan 1, 2012
38.389
+4.064
11.84%
jan 1, 2013
37.783
-0.606
-1.58%
jan 1, 2014
37.138
-0.644
-1.71%
jan 1, 2015
41.971
+4.833
13.01%
jan 1, 2016
36.932
-5.039
-12.01%
Ranking of countries by current statistics by years


Comments: