29
/
en
AIzaSyAYiBZKx7MnpbEhh9jyipgxe19OcubqV5w
April 1, 2024
213082
Nigeria
NGA
true
2
1
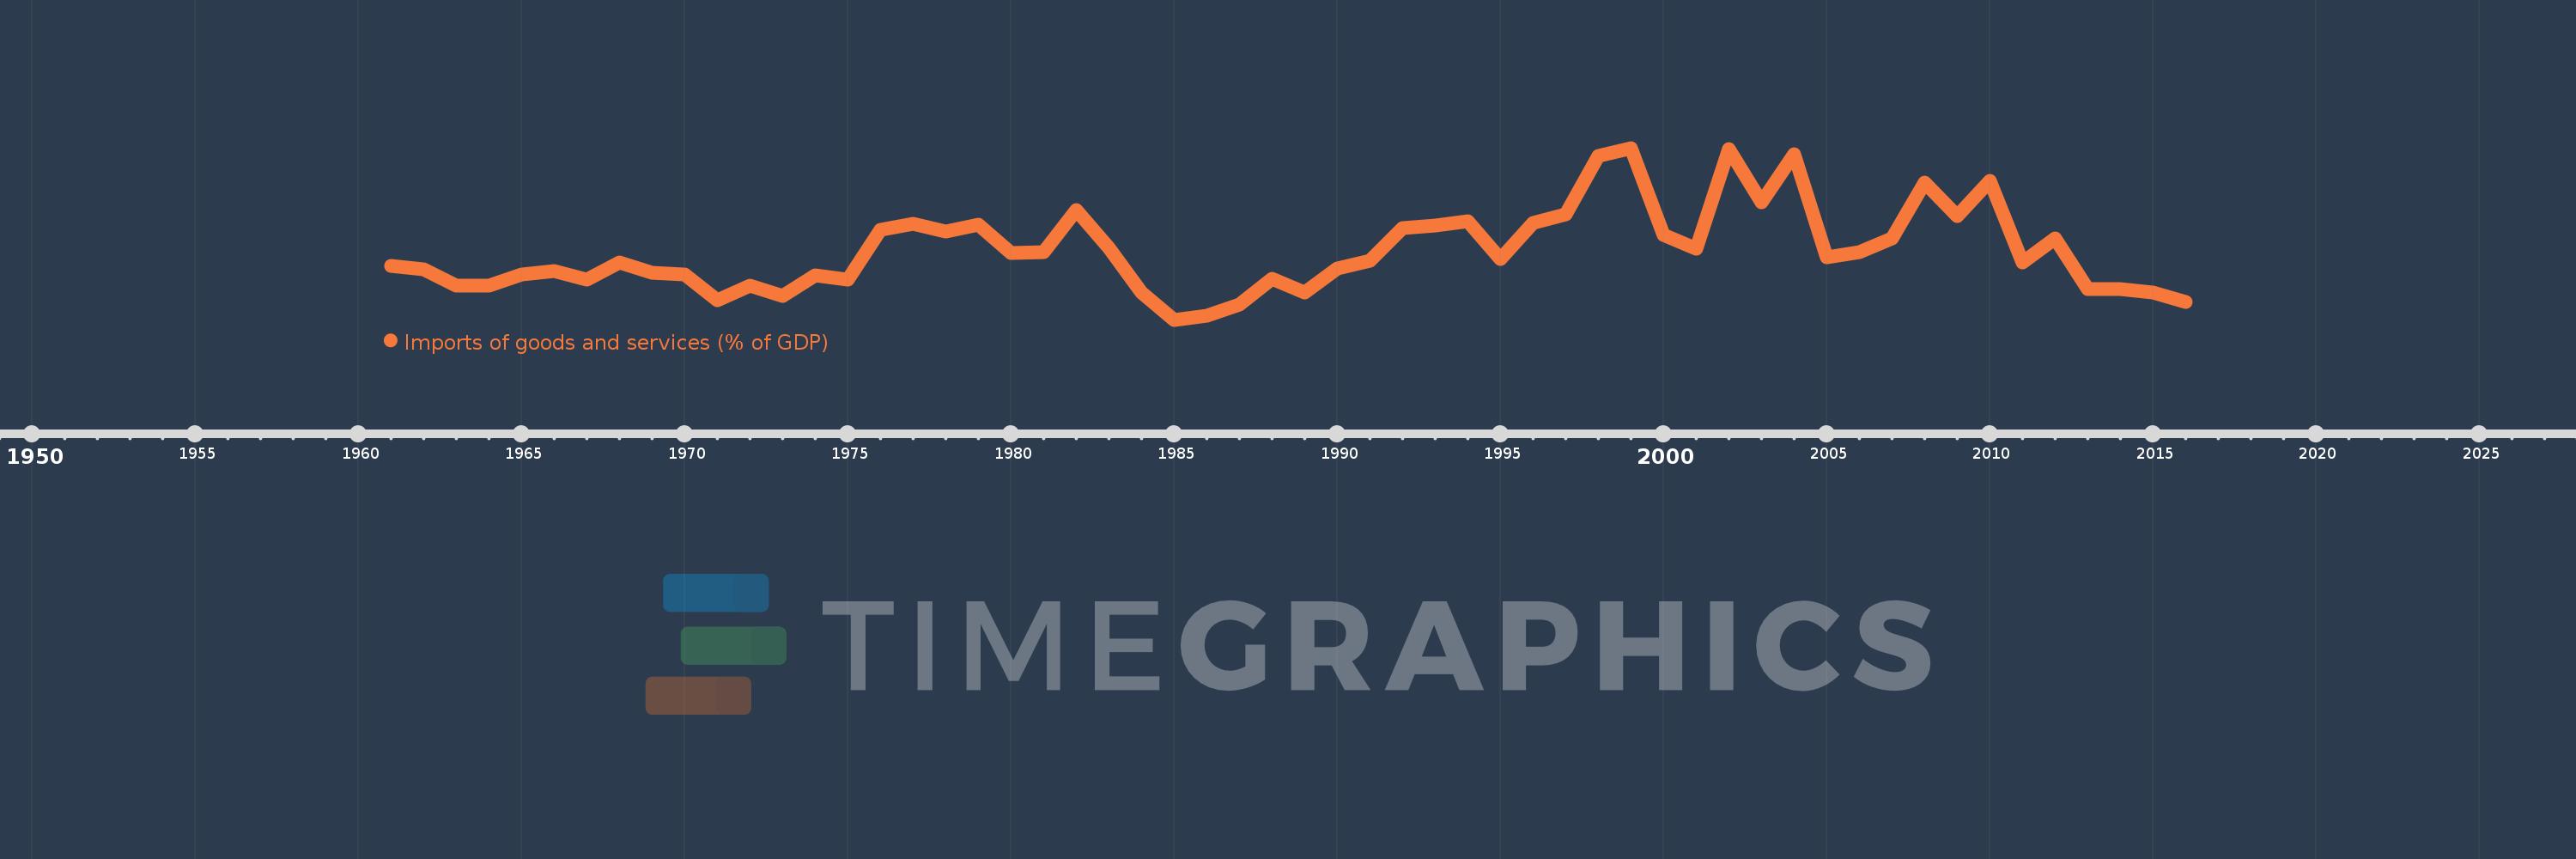
Imports of goods and services (% of GDP)
2016,2015,2014,2013,2012,2011,2010,2009,2008,2007,2006,2005,2004,2003,2002,2001,2000,1999,1998,1997,1996,1995,1994,1993,1992,1991,1990,1989,1988,1987,1986,1985,1984,1983,1982,1981,1980,1979,1978,1977,1976,1975,1974,1973,1972,1971,1970,1969,1968,1967,1966,1965,1964,1963,1962,1961
This statistics in other country:
AfghanistanAlbaniaAlgeriaAngolaAntigua and BarbudaArab WorldArgentinaArmeniaArubaAustraliaAustriaAzerbaijanBahamas, TheBahrainBangladeshBarbadosBelarusBelgiumBelizeBeninBermudaBhutanBoliviaBosnia and HerzegovinaBotswanaBrazilBrunei DarussalamBulgariaBurkina FasoBurundiCabo VerdeCambodiaCameroonCanadaCaribbean small statesCentral African RepublicCentral Europe and the BalticsChadChileChinaColombiaComorosCongo, Dem. Rep.Congo, Rep.Costa RicaCote d'IvoireCroatiaCubaCyprusCzech RepublicDenmarkDjiboutiDominicaDominican RepublicEarly-demographic dividendEast Asia & PacificEast Asia & Pacific (excluding high income)East Asia & Pacific (IDA & IBRD countries)EcuadorEgypt, Arab Rep.El SalvadorEquatorial GuineaEritreaEstoniaEthiopiaEuro areaEurope & Central AsiaEurope & Central Asia (excluding high income)Europe & Central Asia (IDA & IBRD countries)European UnionFaroe IslandsFijiFinlandFragile and conflict affected situationsFranceFrench PolynesiaGabonGambia, TheGeorgiaGermanyGhanaGreeceGrenadaGuatemalaGuineaGuinea-BissauGuyanaHaitiHeavily indebted poor countries (HIPC)High incomeHondurasHong Kong SAR, ChinaHungaryIBRD onlyIcelandIDA & IBRD totalIDA blendIDA onlyIDA totalIndiaIndonesiaIran, Islamic Rep.IraqIrelandIsraelItalyJamaicaJapanJordanKazakhstanKenyaKiribatiKorea, Rep.KosovoKuwaitKyrgyz RepublicLao PDRLate-demographic dividendLatin America & Caribbean Latin America & Caribbean (excluding high income)Latin America & the Caribbean (IDA & IBRD countries)LatviaLeast developed countries: UN classificationLebanonLesothoLiberiaLibyaLithuaniaLow & middle incomeLow incomeLower middle incomeLuxembourgMacao SAR, ChinaMacedonia, FYRMadagascarMalawiMalaysiaMaldivesMaliMaltaMauritaniaMauritiusMexicoMicronesia, Fed. Sts.Middle East & North AfricaMiddle East & North Africa (excluding high income)Middle East & North Africa (IDA & IBRD countries)Middle incomeMoldovaMongoliaMontenegroMoroccoMozambiqueMyanmarNamibiaNepalNetherlandsNew CaledoniaNew ZealandNicaraguaNigerNigeriaNorth AmericaNorwayOECD membersOmanOther small statesPacific island small statesPakistanPalauPanamaPapua New GuineaParaguayPeruPhilippinesPolandPortugalPost-demographic dividendPre-demographic dividendPuerto RicoQatarRomaniaRussian FederationRwandaSamoaSaudi ArabiaSenegalSerbiaSeychellesSierra LeoneSingaporeSlovak RepublicSloveniaSmall statesSolomon IslandsSomaliaSouth AfricaSouth AsiaSouth Asia (IDA & IBRD)South SudanSpainSri LankaSt. Kitts and NevisSt. LuciaSt. Vincent and the GrenadinesSub-Saharan Africa Sub-Saharan Africa (excluding high income)Sub-Saharan Africa (IDA & IBRD countries)SudanSurinameSwazilandSwedenSwitzerlandSyrian Arab RepublicTajikistanTanzaniaThailandTimor-LesteTogoTongaTrinidad and TobagoTunisiaTurkeyTurkmenistanUgandaUkraineUnited Arab EmiratesUnited KingdomUnited StatesUpper middle incomeUruguayUzbekistanVanuatuVenezuela, RBVietnamWest Bank and GazaWorldYemen, Rep.ZambiaZimbabwe Timeline:
This timeline shows a graph from 1961 to 2016 of Nigeria. No data until 1960. Number of actual observations by date: 56.
Source name:
World Development Indicators
Source organization:
World Bank national accounts data, and OECD National Accounts data files.
Categories, topics:
Economy & Growth, Trade
Last updated:
apr 23, 2017
Indicators value changes by year
Maximum:
36.482
jan 1, 1999
At the date of observation
Value
Absolute change
Change from previous value
jan 1, 1961
16.925
+16.925
0.0%
jan 1, 1962
16.3
-0.625
-3.69%
jan 1, 1963
13.56
-2.74
-16.81%
jan 1, 1964
13.537
-0.023
-0.17%
jan 1, 1965
15.413
+1.876
13.86%
jan 1, 1966
16.017
+0.604
3.92%
jan 1, 1967
14.622
-1.395
-8.71%
jan 1, 1968
17.411
+2.789
19.07%
jan 1, 1969
15.736
-1.675
-9.62%
jan 1, 1970
15.43
-0.306
-1.95%
jan 1, 1971
11.214
-4.217
-27.33%
jan 1, 1972
13.629
+2.416
21.54%
jan 1, 1973
11.796
-1.834
-13.46%
jan 1, 1974
15.35
+3.554
30.13%
jan 1, 1975
14.568
-0.781
-5.09%
jan 1, 1976
22.832
+8.263
56.72%
jan 1, 1977
23.922
+1.091
4.78%
jan 1, 1978
22.523
-1.399
-5.85%
jan 1, 1979
23.762
+1.239
5.5%
jan 1, 1980
19.062
-4.7
-19.78%
jan 1, 1981
19.196
+0.134
0.7%
jan 1, 1982
26.106
+6.91
36.0%
jan 1, 1983
19.915
-6.191
-23.72%
jan 1, 1984
12.501
-7.414
-37.23%
jan 1, 1985
7.903
-4.598
-36.78%
jan 1, 1986
8.515
+0.611
7.74%
jan 1, 1987
10.401
+1.886
22.15%
jan 1, 1988
14.705
+4.304
41.38%
jan 1, 1989
12.457
-2.247
-15.28%
jan 1, 1990
16.41
+3.953
31.73%
jan 1, 1991
17.686
+1.276
7.77%
jan 1, 1992
23.176
+5.49
31.04%
jan 1, 1993
23.522
+0.346
1.49%
jan 1, 1994
24.28
+0.758
3.22%
jan 1, 1995
17.999
-6.281
-25.87%
jan 1, 1996
24.006
+6.008
33.38%
jan 1, 1997
25.452
+1.446
6.02%
jan 1, 1998
35.085
+9.633
37.85%
jan 1, 1999
36.482
+1.396
3.98%
jan 1, 2000
21.977
-14.505
-39.76%
jan 1, 2001
19.65
-2.327
-10.59%
jan 1, 2002
36.365
+16.715
85.06%
jan 1, 2003
27.418
-8.947
-24.6%
jan 1, 2004
35.431
+8.013
29.23%
jan 1, 2005
18.287
-17.144
-48.39%
jan 1, 2006
19.091
+0.804
4.4%
jan 1, 2007
21.498
+2.407
12.61%
jan 1, 2008
30.734
+9.236
42.96%
jan 1, 2009
25.09
-5.645
-18.37%
jan 1, 2010
31.034
+5.944
23.69%
jan 1, 2011
17.387
-13.647
-43.97%
jan 1, 2012
21.464
+4.077
23.45%
jan 1, 2013
12.941
-8.523
-39.71%
jan 1, 2014
12.999
+0.058
0.44%
jan 1, 2015
12.45
-0.549
-4.22%
jan 1, 2016
10.79
-1.66
-13.33%
Ranking of countries by current statistics by years


Comments: