29
/
en
AIzaSyAYiBZKx7MnpbEhh9jyipgxe19OcubqV5w
April 1, 2024
92213
British Virgin Islands
VGB
true
2
1
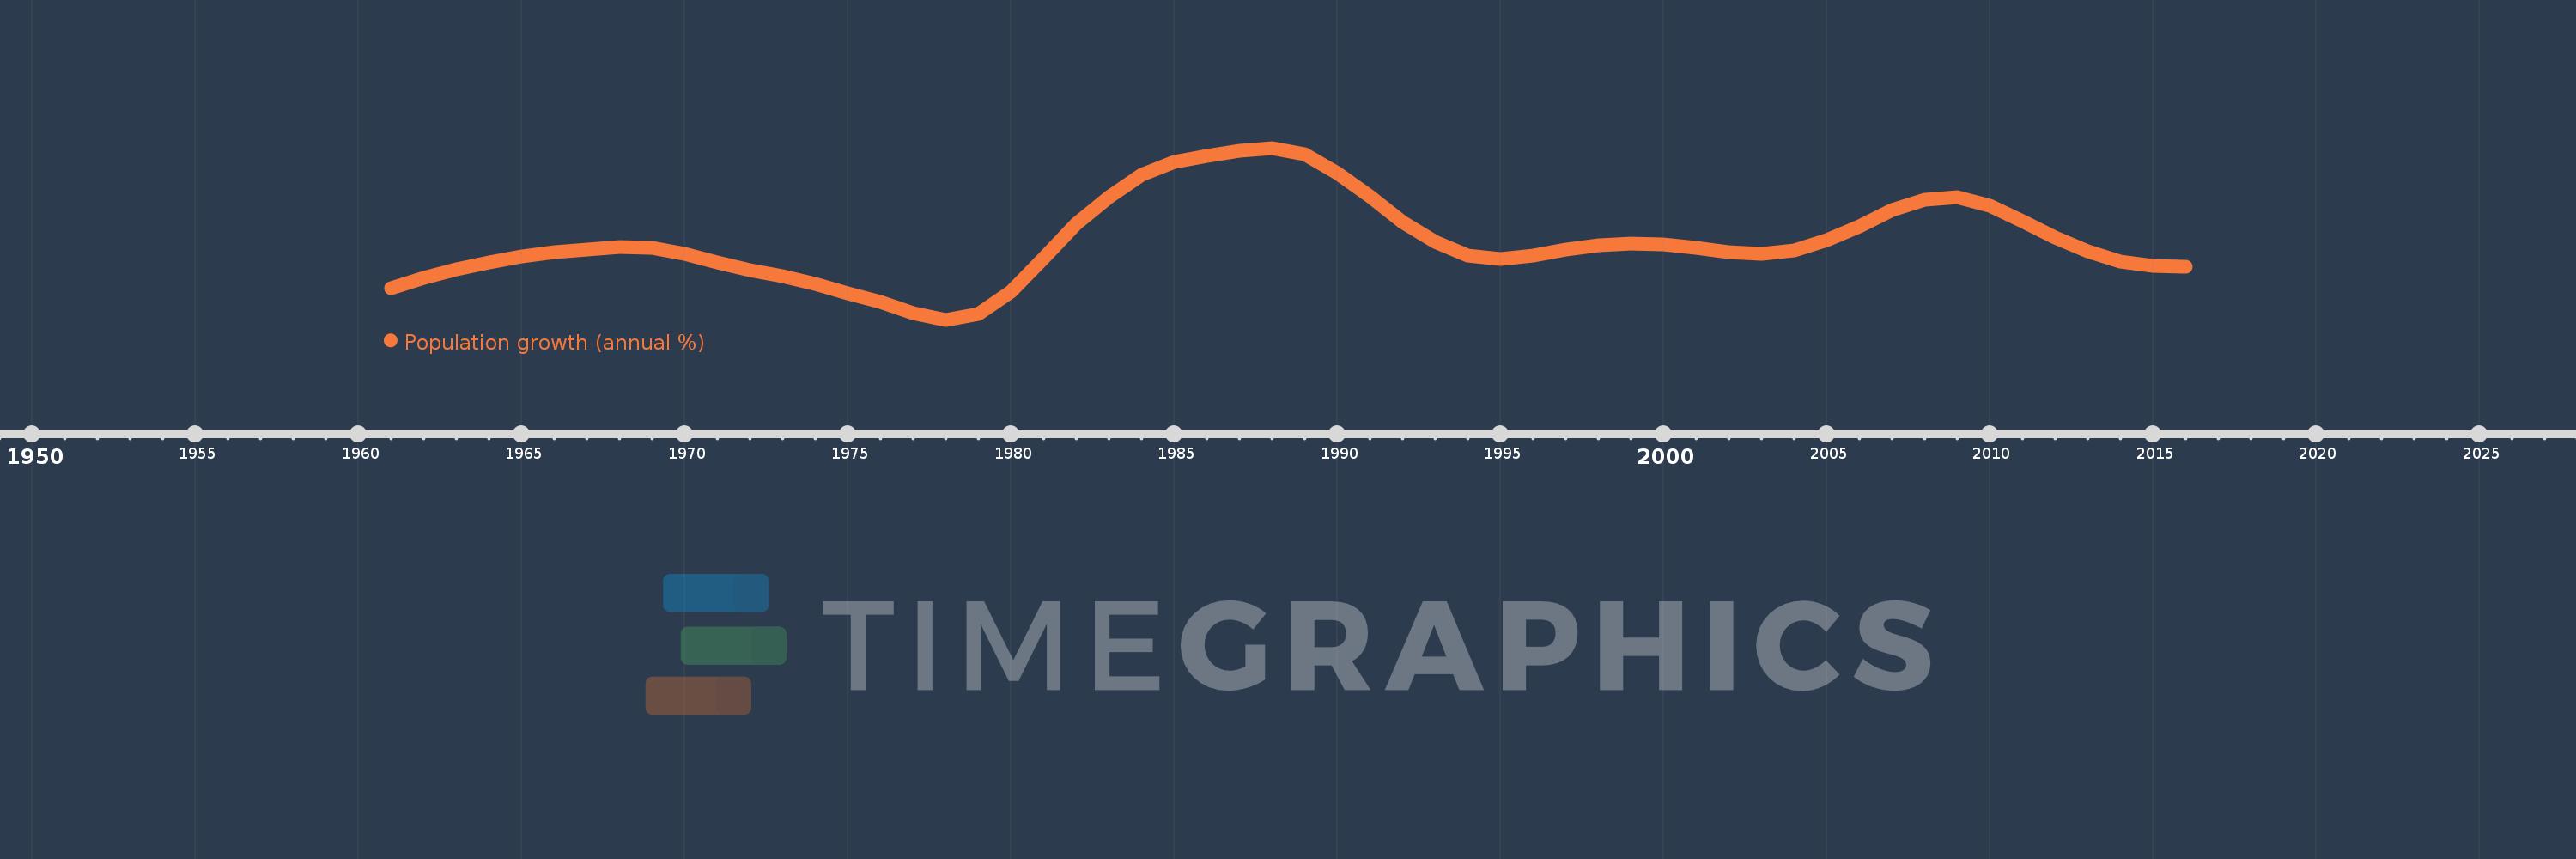
Population growth (annual %)
2016,2015,2014,2013,2012,2011,2010,2009,2008,2007,2006,2005,2004,2003,2002,2001,2000,1999,1998,1997,1996,1995,1994,1993,1992,1991,1990,1989,1988,1987,1986,1985,1984,1983,1982,1981,1980,1979,1978,1977,1976,1975,1974,1973,1972,1971,1970,1969,1968,1967,1966,1965,1964,1963,1962,1961
This statistics in other country:
AfghanistanAlbaniaAlgeriaAmerican SamoaAndorraAngolaAntigua and BarbudaArab WorldArgentinaArmeniaArubaAustraliaAustriaAzerbaijanBahamas, TheBahrainBangladeshBarbadosBelarusBelgiumBelizeBeninBermudaBhutanBoliviaBosnia and HerzegovinaBotswanaBrazilBritish Virgin IslandsBrunei DarussalamBulgariaBurkina FasoBurundiCabo VerdeCambodiaCameroonCanadaCaribbean small statesCayman IslandsCentral African RepublicCentral Europe and the BalticsChadChannel IslandsChileChinaColombiaComorosCongo, Dem. Rep.Congo, Rep.Costa RicaCote d'IvoireCroatiaCubaCuracaoCyprusCzech RepublicDenmarkDjiboutiDominicaDominican RepublicEarly-demographic dividendEast Asia & PacificEast Asia & Pacific (excluding high income)East Asia & Pacific (IDA & IBRD countries)EcuadorEgypt, Arab Rep.El SalvadorEquatorial GuineaEritreaEstoniaEthiopiaEuro areaEurope & Central AsiaEurope & Central Asia (excluding high income)Europe & Central Asia (IDA & IBRD countries)European UnionFaroe IslandsFijiFinlandFragile and conflict affected situationsFranceFrench PolynesiaGabonGambia, TheGeorgiaGermanyGhanaGibraltarGreeceGreenlandGrenadaGuamGuatemalaGuineaGuinea-BissauGuyanaHaitiHeavily indebted poor countries (HIPC)High incomeHondurasHong Kong SAR, ChinaHungaryIBRD onlyIcelandIDA & IBRD totalIDA blendIDA onlyIDA totalIndiaIndonesiaIran, Islamic Rep.IraqIrelandIsle of ManIsraelItalyJamaicaJapanJordanKazakhstanKenyaKiribatiKorea, Dem. People’s Rep.Korea, Rep.KosovoKuwaitKyrgyz RepublicLao PDRLate-demographic dividendLatin America & Caribbean Latin America & Caribbean (excluding high income)Latin America & the Caribbean (IDA & IBRD countries)LatviaLeast developed countries: UN classificationLebanonLesothoLiberiaLibyaLiechtensteinLithuaniaLow & middle incomeLow incomeLower middle incomeLuxembourgMacao SAR, ChinaMacedonia, FYRMadagascarMalawiMalaysiaMaldivesMaliMaltaMarshall IslandsMauritaniaMauritiusMexicoMicronesia, Fed. Sts.Middle East & North AfricaMiddle East & North Africa (excluding high income)Middle East & North Africa (IDA & IBRD countries)Middle incomeMoldovaMonacoMongoliaMontenegroMoroccoMozambiqueMyanmarNamibiaNauruNepalNetherlandsNew CaledoniaNew ZealandNicaraguaNigerNigeriaNorth AmericaNorthern Mariana IslandsNorwayOECD membersOmanOther small statesPacific island small statesPakistanPalauPanamaPapua New GuineaParaguayPeruPhilippinesPolandPortugalPost-demographic dividendPre-demographic dividendPuerto RicoQatarRomaniaRussian FederationRwandaSamoaSan MarinoSao Tome and PrincipeSaudi ArabiaSenegalSerbiaSeychellesSierra LeoneSingaporeSint Maarten (Dutch part)Slovak RepublicSloveniaSmall statesSolomon IslandsSomaliaSouth AfricaSouth AsiaSouth Asia (IDA & IBRD)South SudanSpainSri LankaSt. Kitts and NevisSt. LuciaSt. Martin (French part)St. Vincent and the GrenadinesSub-Saharan Africa Sub-Saharan Africa (excluding high income)Sub-Saharan Africa (IDA & IBRD countries)SudanSurinameSwazilandSwedenSwitzerlandSyrian Arab RepublicTajikistanTanzaniaThailandTimor-LesteTogoTongaTrinidad and TobagoTunisiaTurkeyTurkmenistanTurks and Caicos IslandsTuvaluUgandaUkraineUnited Arab EmiratesUnited KingdomUnited StatesUpper middle incomeUruguayUzbekistanVanuatuVenezuela, RBVietnamVirgin Islands (U.S.)West Bank and GazaWorldYemen, Rep.ZambiaZimbabwe Timeline:
This timeline shows a graph from 1961 to 2016 of British Virgin Islands. No data until 1960. Number of actual observations by date: 56.
Source name:
World Development Indicators
Source organization:
Derived from total population. Population source: (1) United Nations Population Division. World Population Prospects, (2) United Nations Statistical Division. Population and Vital Statistics Report (various years), (3) Census reports and other statistical
Categories, topics:
Climate Change, Health
Last updated:
apr 23, 2017
Indicators value changes by year
At the date of observation
Value
Absolute change
Change from previous value
jan 1, 1961
1.265
+1.265
0.0%
jan 1, 1962
1.495
+0.23
18.16%
jan 1, 1963
1.714
+0.219
14.67%
jan 1, 1964
1.874
+0.161
9.37%
jan 1, 1965
2.025
+0.151
8.06%
jan 1, 1966
2.122
+0.096
4.74%
jan 1, 1967
2.2
+0.078
3.68%
jan 1, 1968
2.25
+0.05
2.29%
jan 1, 1969
2.232
-0.018
-0.79%
jan 1, 1970
2.08
-0.153
-6.84%
jan 1, 1971
1.874
-0.205
-9.88%
jan 1, 1972
1.689
-0.185
-9.86%
jan 1, 1973
1.553
-0.137
-8.09%
jan 1, 1974
1.354
-0.199
-12.81%
jan 1, 1975
1.134
-0.22
-16.27%
jan 1, 1976
0.921
-0.213
-18.79%
jan 1, 1977
0.647
-0.274
-29.72%
jan 1, 1978
0.492
-0.155
-23.96%
jan 1, 1979
0.63
+0.138
28.13%
jan 1, 1980
1.165
+0.535
84.9%
jan 1, 1981
1.973
+0.808
69.32%
jan 1, 1982
2.805
+0.832
42.14%
jan 1, 1983
3.465
+0.66
23.54%
jan 1, 1984
3.991
+0.526
15.17%
jan 1, 1985
4.31
+0.319
8.0%
jan 1, 1986
4.448
+0.138
3.2%
jan 1, 1987
4.582
+0.134
3.01%
jan 1, 1988
4.649
+0.067
1.46%
jan 1, 1989
4.488
-0.161
-3.46%
jan 1, 1990
4.05
-0.438
-9.76%
jan 1, 1991
3.48
-0.57
-14.07%
jan 1, 1992
2.863
-0.618
-17.75%
jan 1, 1993
2.369
-0.494
-17.25%
jan 1, 1994
2.038
-0.331
-13.98%
jan 1, 1995
1.964
-0.074
-3.63%
jan 1, 1996
2.051
+0.087
4.44%
jan 1, 1997
2.196
+0.145
7.06%
jan 1, 1998
2.289
+0.093
4.24%
jan 1, 1999
2.339
+0.05
2.2%
jan 1, 2000
2.305
-0.034
-1.44%
jan 1, 2001
2.239
-0.066
-2.88%
jan 1, 2002
2.128
-0.111
-4.94%
jan 1, 2003
2.079
-0.049
-2.3%
jan 1, 2004
2.16
+0.08
3.87%
jan 1, 2005
2.416
+0.257
11.88%
jan 1, 2006
2.761
+0.345
14.29%
jan 1, 2007
3.14
+0.379
13.71%
jan 1, 2008
3.401
+0.261
8.31%
jan 1, 2009
3.453
+0.052
1.54%
jan 1, 2010
3.251
-0.202
-5.86%
jan 1, 2011
2.881
-0.37
-11.39%
jan 1, 2012
2.478
-0.403
-13.98%
jan 1, 2013
2.145
-0.333
-13.44%
jan 1, 2014
1.9
-0.244
-11.4%
jan 1, 2015
1.797
-0.103
-5.42%
jan 1, 2016
1.782
-0.015
-0.84%
Ranking of countries by current statistics by years


Comments: