29
/
en
AIzaSyAYiBZKx7MnpbEhh9jyipgxe19OcubqV5w
April 1, 2024
180301
Libya
LBY
true
2
1
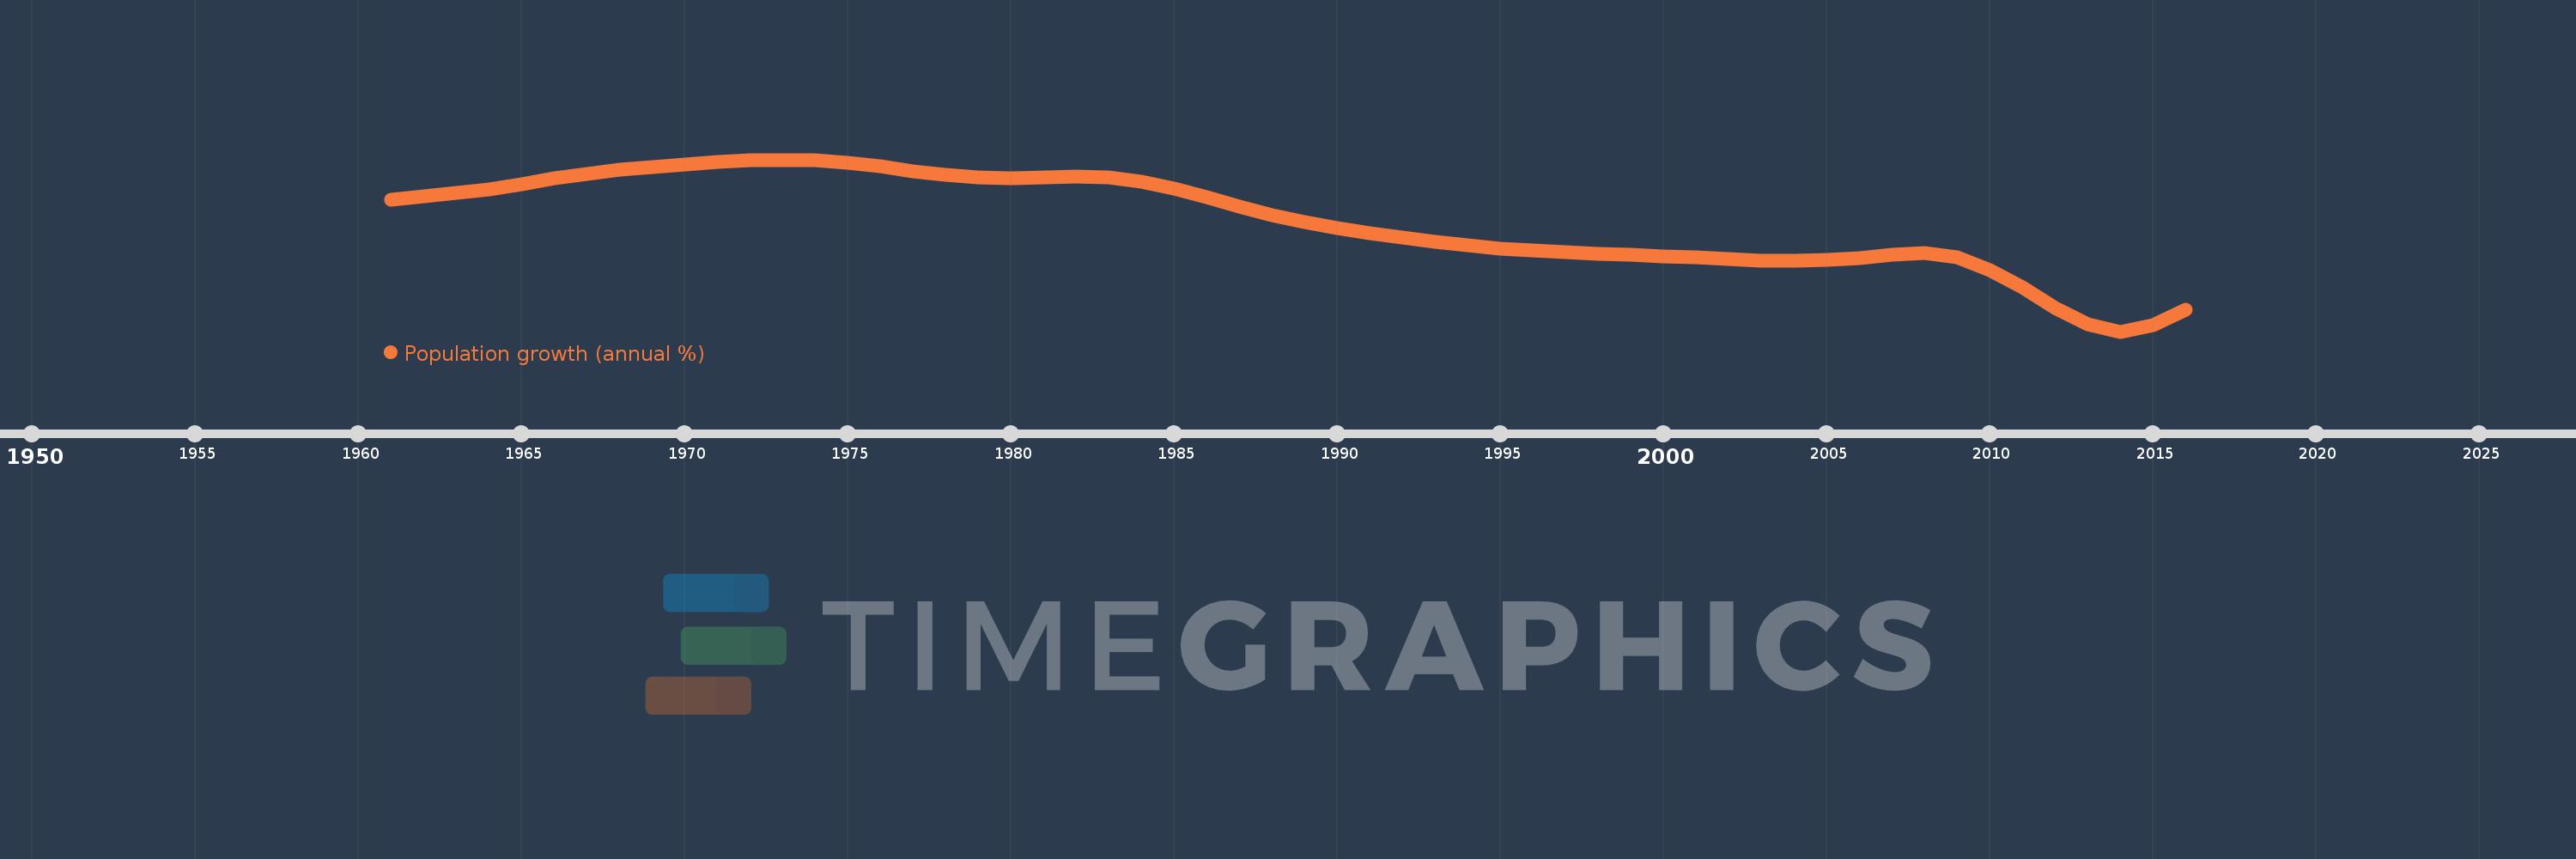
Population growth (annual %)
2016,2015,2014,2013,2012,2011,2010,2009,2008,2007,2006,2005,2004,2003,2002,2001,2000,1999,1998,1997,1996,1995,1994,1993,1992,1991,1990,1989,1988,1987,1986,1985,1984,1983,1982,1981,1980,1979,1978,1977,1976,1975,1974,1973,1972,1971,1970,1969,1968,1967,1966,1965,1964,1963,1962,1961
This statistics in other country:
AfghanistanAlbaniaAlgeriaAmerican SamoaAndorraAngolaAntigua and BarbudaArab WorldArgentinaArmeniaArubaAustraliaAustriaAzerbaijanBahamas, TheBahrainBangladeshBarbadosBelarusBelgiumBelizeBeninBermudaBhutanBoliviaBosnia and HerzegovinaBotswanaBrazilBritish Virgin IslandsBrunei DarussalamBulgariaBurkina FasoBurundiCabo VerdeCambodiaCameroonCanadaCaribbean small statesCayman IslandsCentral African RepublicCentral Europe and the BalticsChadChannel IslandsChileChinaColombiaComorosCongo, Dem. Rep.Congo, Rep.Costa RicaCote d'IvoireCroatiaCubaCuracaoCyprusCzech RepublicDenmarkDjiboutiDominicaDominican RepublicEarly-demographic dividendEast Asia & PacificEast Asia & Pacific (excluding high income)East Asia & Pacific (IDA & IBRD countries)EcuadorEgypt, Arab Rep.El SalvadorEquatorial GuineaEritreaEstoniaEthiopiaEuro areaEurope & Central AsiaEurope & Central Asia (excluding high income)Europe & Central Asia (IDA & IBRD countries)European UnionFaroe IslandsFijiFinlandFragile and conflict affected situationsFranceFrench PolynesiaGabonGambia, TheGeorgiaGermanyGhanaGibraltarGreeceGreenlandGrenadaGuamGuatemalaGuineaGuinea-BissauGuyanaHaitiHeavily indebted poor countries (HIPC)High incomeHondurasHong Kong SAR, ChinaHungaryIBRD onlyIcelandIDA & IBRD totalIDA blendIDA onlyIDA totalIndiaIndonesiaIran, Islamic Rep.IraqIrelandIsle of ManIsraelItalyJamaicaJapanJordanKazakhstanKenyaKiribatiKorea, Dem. People’s Rep.Korea, Rep.KosovoKuwaitKyrgyz RepublicLao PDRLate-demographic dividendLatin America & Caribbean Latin America & Caribbean (excluding high income)Latin America & the Caribbean (IDA & IBRD countries)LatviaLeast developed countries: UN classificationLebanonLesothoLiberiaLibyaLiechtensteinLithuaniaLow & middle incomeLow incomeLower middle incomeLuxembourgMacao SAR, ChinaMacedonia, FYRMadagascarMalawiMalaysiaMaldivesMaliMaltaMarshall IslandsMauritaniaMauritiusMexicoMicronesia, Fed. Sts.Middle East & North AfricaMiddle East & North Africa (excluding high income)Middle East & North Africa (IDA & IBRD countries)Middle incomeMoldovaMonacoMongoliaMontenegroMoroccoMozambiqueMyanmarNamibiaNauruNepalNetherlandsNew CaledoniaNew ZealandNicaraguaNigerNigeriaNorth AmericaNorthern Mariana IslandsNorwayOECD membersOmanOther small statesPacific island small statesPakistanPalauPanamaPapua New GuineaParaguayPeruPhilippinesPolandPortugalPost-demographic dividendPre-demographic dividendPuerto RicoQatarRomaniaRussian FederationRwandaSamoaSan MarinoSao Tome and PrincipeSaudi ArabiaSenegalSerbiaSeychellesSierra LeoneSingaporeSint Maarten (Dutch part)Slovak RepublicSloveniaSmall statesSolomon IslandsSomaliaSouth AfricaSouth AsiaSouth Asia (IDA & IBRD)South SudanSpainSri LankaSt. Kitts and NevisSt. LuciaSt. Martin (French part)St. Vincent and the GrenadinesSub-Saharan Africa Sub-Saharan Africa (excluding high income)Sub-Saharan Africa (IDA & IBRD countries)SudanSurinameSwazilandSwedenSwitzerlandSyrian Arab RepublicTajikistanTanzaniaThailandTimor-LesteTogoTongaTrinidad and TobagoTunisiaTurkeyTurkmenistanTurks and Caicos IslandsTuvaluUgandaUkraineUnited Arab EmiratesUnited KingdomUnited StatesUpper middle incomeUruguayUzbekistanVanuatuVenezuela, RBVietnamVirgin Islands (U.S.)West Bank and GazaWorldYemen, Rep.ZambiaZimbabwe Timeline:
This timeline shows a graph from 1961 to 2016 of Libya. No data until 1960. Number of actual observations by date: 56.
Source name:
World Development Indicators
Source organization:
Derived from total population. Population source: (1) United Nations Population Division. World Population Prospects, (2) United Nations Statistical Division. Population and Vital Statistics Report (various years), (3) Census reports and other statistical
Categories, topics:
Climate Change, Health
Last updated:
apr 23, 2017
Indicators value changes by year
Minimum:
-0.278
jan 1, 2014
At the date of observation
Value
Absolute change
Change from previous value
jan 1, 1961
3.291
+3.291
0.0%
jan 1, 1962
3.377
+0.087
2.63%
jan 1, 1963
3.467
+0.089
2.64%
jan 1, 1964
3.575
+0.109
3.13%
jan 1, 1965
3.71
+0.135
3.78%
jan 1, 1966
3.856
+0.146
3.93%
jan 1, 1967
3.986
+0.129
3.35%
jan 1, 1968
4.089
+0.103
2.58%
jan 1, 1969
4.176
+0.088
2.14%
jan 1, 1970
4.248
+0.071
1.71%
jan 1, 1971
4.3
+0.052
1.23%
jan 1, 1972
4.344
+0.044
1.02%
jan 1, 1973
4.366
+0.022
0.51%
jan 1, 1974
4.345
-0.021
-0.48%
jan 1, 1975
4.277
-0.068
-1.56%
jan 1, 1976
4.181
-0.096
-2.24%
jan 1, 1977
4.06
-0.121
-2.89%
jan 1, 1978
3.95
-0.11
-2.72%
jan 1, 1979
3.884
-0.066
-1.66%
jan 1, 1980
3.875
-0.01
-0.24%
jan 1, 1981
3.89
+0.015
0.4%
jan 1, 1982
3.91
+0.02
0.51%
jan 1, 1983
3.887
-0.024
-0.6%
jan 1, 1984
3.785
-0.101
-2.6%
jan 1, 1985
3.593
-0.193
-5.09%
jan 1, 1986
3.346
-0.247
-6.88%
jan 1, 1987
3.095
-0.251
-7.49%
jan 1, 1988
2.875
-0.22
-7.12%
jan 1, 1989
2.68
-0.194
-6.76%
jan 1, 1990
2.521
-0.159
-5.93%
jan 1, 1991
2.39
-0.131
-5.2%
jan 1, 1992
2.266
-0.124
-5.2%
jan 1, 1993
2.146
-0.12
-5.28%
jan 1, 1994
2.048
-0.098
-4.56%
jan 1, 1995
1.974
-0.074
-3.61%
jan 1, 1996
1.919
-0.055
-2.81%
jan 1, 1997
1.872
-0.047
-2.43%
jan 1, 1998
1.829
-0.043
-2.28%
jan 1, 1999
1.793
-0.036
-1.97%
jan 1, 2000
1.763
-0.031
-1.71%
jan 1, 2001
1.736
-0.027
-1.52%
jan 1, 2002
1.691
-0.045
-2.57%
jan 1, 2003
1.645
-0.046
-2.74%
jan 1, 2004
1.632
-0.013
-0.77%
jan 1, 2005
1.663
+0.03
1.87%
jan 1, 2006
1.709
+0.046
2.78%
jan 1, 2007
1.804
+0.095
5.54%
jan 1, 2008
1.856
+0.052
2.87%
jan 1, 2009
1.734
-0.122
-6.59%
jan 1, 2010
1.389
-0.344
-19.86%
jan 1, 2011
0.914
-0.475
-34.2%
jan 1, 2012
0.366
-0.548
-60.0%
jan 1, 2013
-0.084
-0.449
-122.83%
jan 1, 2014
-0.278
-0.194
232.4%
jan 1, 2015
-0.112
+0.166
-59.71%
jan 1, 2016
0.31
+0.422
-377.52%
Ranking of countries by current statistics by years


Comments: