29
/
en
AIzaSyAYiBZKx7MnpbEhh9jyipgxe19OcubqV5w
April 1, 2024
285090
Yemen, Rep.
YEM
true
2
1
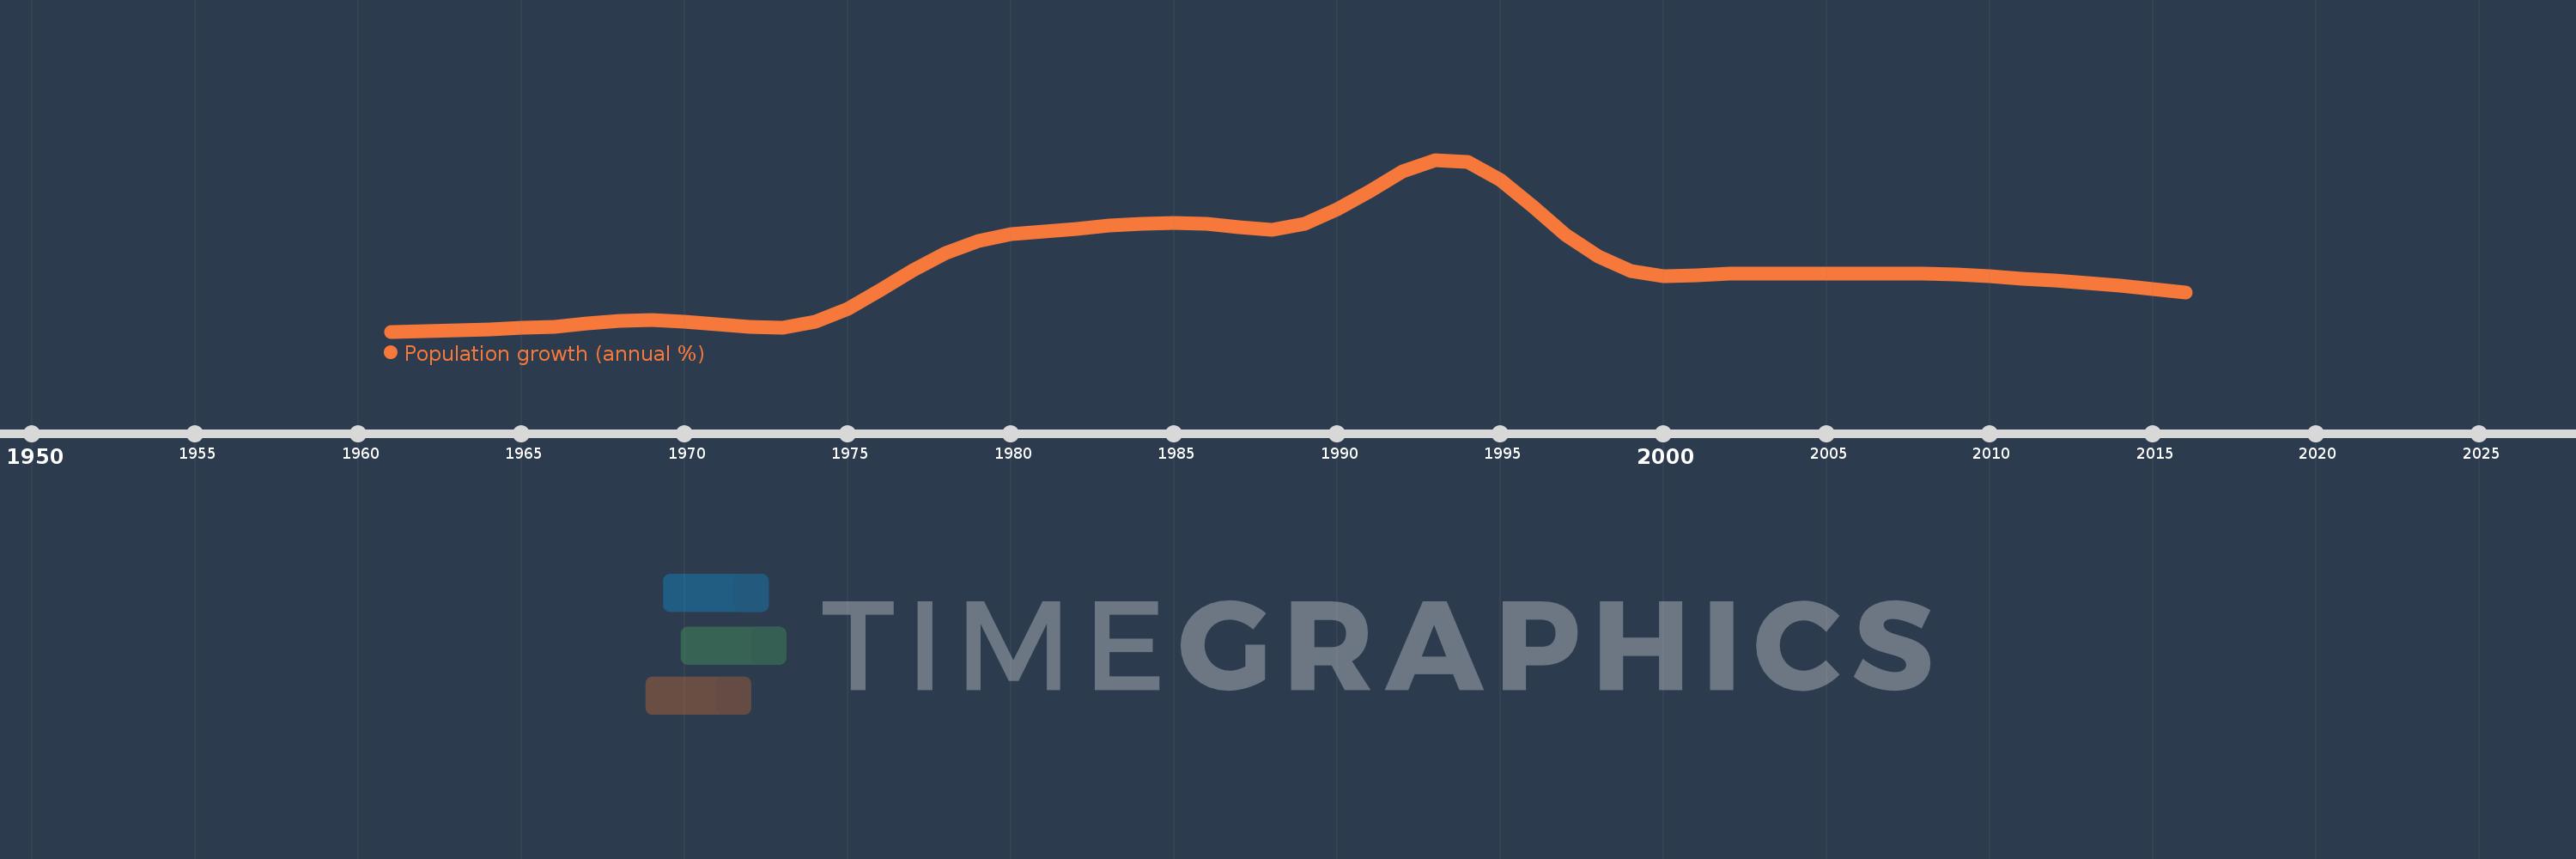
Population growth (annual %)
2016,2015,2014,2013,2012,2011,2010,2009,2008,2007,2006,2005,2004,2003,2002,2001,2000,1999,1998,1997,1996,1995,1994,1993,1992,1991,1990,1989,1988,1987,1986,1985,1984,1983,1982,1981,1980,1979,1978,1977,1976,1975,1974,1973,1972,1971,1970,1969,1968,1967,1966,1965,1964,1963,1962,1961
This statistics in other country:
AfghanistanAlbaniaAlgeriaAmerican SamoaAndorraAngolaAntigua and BarbudaArab WorldArgentinaArmeniaArubaAustraliaAustriaAzerbaijanBahamas, TheBahrainBangladeshBarbadosBelarusBelgiumBelizeBeninBermudaBhutanBoliviaBosnia and HerzegovinaBotswanaBrazilBritish Virgin IslandsBrunei DarussalamBulgariaBurkina FasoBurundiCabo VerdeCambodiaCameroonCanadaCaribbean small statesCayman IslandsCentral African RepublicCentral Europe and the BalticsChadChannel IslandsChileChinaColombiaComorosCongo, Dem. Rep.Congo, Rep.Costa RicaCote d'IvoireCroatiaCubaCuracaoCyprusCzech RepublicDenmarkDjiboutiDominicaDominican RepublicEarly-demographic dividendEast Asia & PacificEast Asia & Pacific (excluding high income)East Asia & Pacific (IDA & IBRD countries)EcuadorEgypt, Arab Rep.El SalvadorEquatorial GuineaEritreaEstoniaEthiopiaEuro areaEurope & Central AsiaEurope & Central Asia (excluding high income)Europe & Central Asia (IDA & IBRD countries)European UnionFaroe IslandsFijiFinlandFragile and conflict affected situationsFranceFrench PolynesiaGabonGambia, TheGeorgiaGermanyGhanaGibraltarGreeceGreenlandGrenadaGuamGuatemalaGuineaGuinea-BissauGuyanaHaitiHeavily indebted poor countries (HIPC)High incomeHondurasHong Kong SAR, ChinaHungaryIBRD onlyIcelandIDA & IBRD totalIDA blendIDA onlyIDA totalIndiaIndonesiaIran, Islamic Rep.IraqIrelandIsle of ManIsraelItalyJamaicaJapanJordanKazakhstanKenyaKiribatiKorea, Dem. People’s Rep.Korea, Rep.KosovoKuwaitKyrgyz RepublicLao PDRLate-demographic dividendLatin America & Caribbean Latin America & Caribbean (excluding high income)Latin America & the Caribbean (IDA & IBRD countries)LatviaLeast developed countries: UN classificationLebanonLesothoLiberiaLibyaLiechtensteinLithuaniaLow & middle incomeLow incomeLower middle incomeLuxembourgMacao SAR, ChinaMacedonia, FYRMadagascarMalawiMalaysiaMaldivesMaliMaltaMarshall IslandsMauritaniaMauritiusMexicoMicronesia, Fed. Sts.Middle East & North AfricaMiddle East & North Africa (excluding high income)Middle East & North Africa (IDA & IBRD countries)Middle incomeMoldovaMonacoMongoliaMontenegroMoroccoMozambiqueMyanmarNamibiaNauruNepalNetherlandsNew CaledoniaNew ZealandNicaraguaNigerNigeriaNorth AmericaNorthern Mariana IslandsNorwayOECD membersOmanOther small statesPacific island small statesPakistanPalauPanamaPapua New GuineaParaguayPeruPhilippinesPolandPortugalPost-demographic dividendPre-demographic dividendPuerto RicoQatarRomaniaRussian FederationRwandaSamoaSan MarinoSao Tome and PrincipeSaudi ArabiaSenegalSerbiaSeychellesSierra LeoneSingaporeSint Maarten (Dutch part)Slovak RepublicSloveniaSmall statesSolomon IslandsSomaliaSouth AfricaSouth AsiaSouth Asia (IDA & IBRD)South SudanSpainSri LankaSt. Kitts and NevisSt. LuciaSt. Martin (French part)St. Vincent and the GrenadinesSub-Saharan Africa Sub-Saharan Africa (excluding high income)Sub-Saharan Africa (IDA & IBRD countries)SudanSurinameSwazilandSwedenSwitzerlandSyrian Arab RepublicTajikistanTanzaniaThailandTimor-LesteTogoTongaTrinidad and TobagoTunisiaTurkeyTurkmenistanTurks and Caicos IslandsTuvaluUgandaUkraineUnited Arab EmiratesUnited KingdomUnited StatesUpper middle incomeUruguayUzbekistanVanuatuVenezuela, RBVietnamVirgin Islands (U.S.)West Bank and GazaWorldYemen, Rep.ZambiaZimbabwe Timeline:
This timeline shows a graph from 1961 to 2016 of Yemen, Rep.. No data until 1960. Number of actual observations by date: 56.
Source name:
World Development Indicators
Source organization:
Derived from total population. Population source: (1) United Nations Population Division. World Population Prospects, (2) United Nations Statistical Division. Population and Vital Statistics Report (various years), (3) Census reports and other statistical
Categories, topics:
Climate Change, Health
Last updated:
apr 23, 2017
Indicators value changes by year
At the date of observation
Value
Absolute change
Change from previous value
jan 1, 1961
1.626
+1.626
0.0%
jan 1, 1962
1.639
+0.013
0.79%
jan 1, 1963
1.655
+0.016
0.98%
jan 1, 1964
1.676
+0.021
1.26%
jan 1, 1965
1.702
+0.026
1.57%
jan 1, 1966
1.732
+0.03
1.77%
jan 1, 1967
1.788
+0.056
3.23%
jan 1, 1968
1.848
+0.06
3.35%
jan 1, 1969
1.868
+0.021
1.12%
jan 1, 1970
1.838
-0.031
-1.65%
jan 1, 1971
1.786
-0.051
-2.78%
jan 1, 1972
1.718
-0.068
-3.81%
jan 1, 1973
1.704
-0.014
-0.81%
jan 1, 1974
1.824
+0.119
7.0%
jan 1, 1975
2.11
+0.286
15.7%
jan 1, 1976
2.5
+0.39
18.5%
jan 1, 1977
2.914
+0.413
16.52%
jan 1, 1978
3.264
+0.35
12.01%
jan 1, 1979
3.522
+0.258
7.91%
jan 1, 1980
3.661
+0.14
3.97%
jan 1, 1981
3.72
+0.059
1.6%
jan 1, 1982
3.778
+0.058
1.57%
jan 1, 1983
3.851
+0.073
1.92%
jan 1, 1984
3.889
+0.038
0.98%
jan 1, 1985
3.892
+0.003
0.08%
jan 1, 1986
3.882
-0.009
-0.24%
jan 1, 1987
3.808
-0.074
-1.91%
jan 1, 1988
3.759
-0.048
-1.27%
jan 1, 1989
3.874
+0.114
3.03%
jan 1, 1990
4.181
+0.308
7.94%
jan 1, 1991
4.569
+0.388
9.27%
jan 1, 1992
4.975
+0.406
8.89%
jan 1, 1993
5.221
+0.246
4.94%
jan 1, 1994
5.172
-0.048
-0.93%
jan 1, 1995
4.794
-0.378
-7.31%
jan 1, 1996
4.235
-0.559
-11.66%
jan 1, 1997
3.657
-0.578
-13.66%
jan 1, 1998
3.201
-0.456
-12.47%
jan 1, 1999
2.894
-0.307
-9.58%
jan 1, 2000
2.78
-0.114
-3.94%
jan 1, 2001
2.797
+0.016
0.59%
jan 1, 2002
2.831
+0.035
1.24%
jan 1, 2003
2.832
+0.0
0.01%
jan 1, 2004
2.837
+0.005
0.18%
jan 1, 2005
2.837
+0.0
0.02%
jan 1, 2006
2.833
-0.004
-0.15%
jan 1, 2007
2.835
+0.002
0.06%
jan 1, 2008
2.838
+0.003
0.1%
jan 1, 2009
2.824
-0.013
-0.48%
jan 1, 2010
2.79
-0.034
-1.21%
jan 1, 2011
2.74
-0.049
-1.77%
jan 1, 2012
2.689
-0.052
-1.88%
jan 1, 2013
2.638
-0.051
-1.89%
jan 1, 2014
2.58
-0.058
-2.19%
jan 1, 2015
2.516
-0.065
-2.51%
jan 1, 2016
2.447
-0.069
-2.74%
Ranking of countries by current statistics by years


Comments: