29
/
en
AIzaSyAYiBZKx7MnpbEhh9jyipgxe19OcubqV5w
April 1, 2024
212183
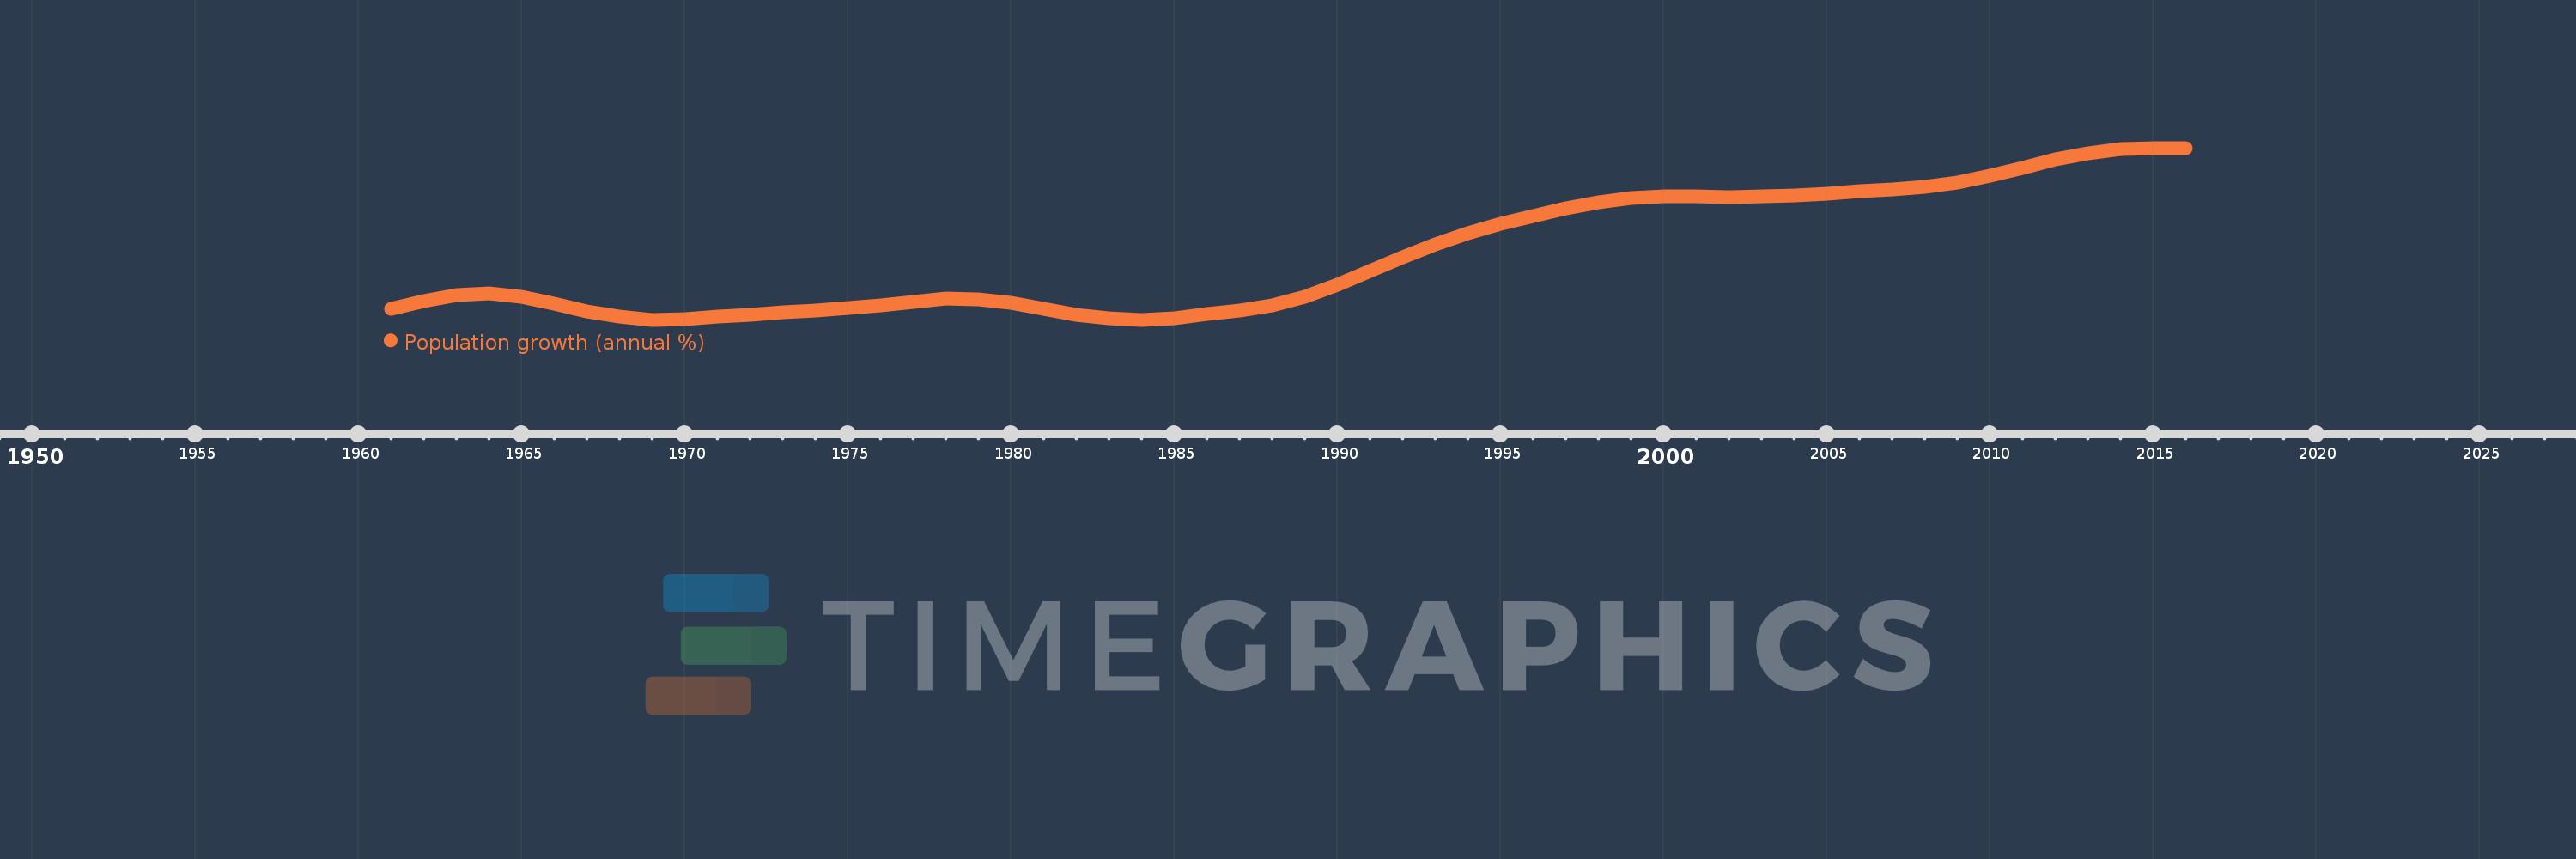
Niger
NER
true
2
1
Population growth (annual %)
2016,2015,2014,2013,2012,2011,2010,2009,2008,2007,2006,2005,2004,2003,2002,2001,2000,1999,1998,1997,1996,1995,1994,1993,1992,1991,1990,1989,1988,1987,1986,1985,1984,1983,1982,1981,1980,1979,1978,1977,1976,1975,1974,1973,1972,1971,1970,1969,1968,1967,1966,1965,1964,1963,1962,1961
This statistics in other country:
AfghanistanAlbaniaAlgeriaAmerican SamoaAndorraAngolaAntigua and BarbudaArab WorldArgentinaArmeniaArubaAustraliaAustriaAzerbaijanBahamas, TheBahrainBangladeshBarbadosBelarusBelgiumBelizeBeninBermudaBhutanBoliviaBosnia and HerzegovinaBotswanaBrazilBritish Virgin IslandsBrunei DarussalamBulgariaBurkina FasoBurundiCabo VerdeCambodiaCameroonCanadaCaribbean small statesCayman IslandsCentral African RepublicCentral Europe and the BalticsChadChannel IslandsChileChinaColombiaComorosCongo, Dem. Rep.Congo, Rep.Costa RicaCote d'IvoireCroatiaCubaCuracaoCyprusCzech RepublicDenmarkDjiboutiDominicaDominican RepublicEarly-demographic dividendEast Asia & PacificEast Asia & Pacific (excluding high income)East Asia & Pacific (IDA & IBRD countries)EcuadorEgypt, Arab Rep.El SalvadorEquatorial GuineaEritreaEstoniaEthiopiaEuro areaEurope & Central AsiaEurope & Central Asia (excluding high income)Europe & Central Asia (IDA & IBRD countries)European UnionFaroe IslandsFijiFinlandFragile and conflict affected situationsFranceFrench PolynesiaGabonGambia, TheGeorgiaGermanyGhanaGibraltarGreeceGreenlandGrenadaGuamGuatemalaGuineaGuinea-BissauGuyanaHaitiHeavily indebted poor countries (HIPC)High incomeHondurasHong Kong SAR, ChinaHungaryIBRD onlyIcelandIDA & IBRD totalIDA blendIDA onlyIDA totalIndiaIndonesiaIran, Islamic Rep.IraqIrelandIsle of ManIsraelItalyJamaicaJapanJordanKazakhstanKenyaKiribatiKorea, Dem. People’s Rep.Korea, Rep.KosovoKuwaitKyrgyz RepublicLao PDRLate-demographic dividendLatin America & Caribbean Latin America & Caribbean (excluding high income)Latin America & the Caribbean (IDA & IBRD countries)LatviaLeast developed countries: UN classificationLebanonLesothoLiberiaLibyaLiechtensteinLithuaniaLow & middle incomeLow incomeLower middle incomeLuxembourgMacao SAR, ChinaMacedonia, FYRMadagascarMalawiMalaysiaMaldivesMaliMaltaMarshall IslandsMauritaniaMauritiusMexicoMicronesia, Fed. Sts.Middle East & North AfricaMiddle East & North Africa (excluding high income)Middle East & North Africa (IDA & IBRD countries)Middle incomeMoldovaMonacoMongoliaMontenegroMoroccoMozambiqueMyanmarNamibiaNauruNepalNetherlandsNew CaledoniaNew ZealandNicaraguaNigerNigeriaNorth AmericaNorthern Mariana IslandsNorwayOECD membersOmanOther small statesPacific island small statesPakistanPalauPanamaPapua New GuineaParaguayPeruPhilippinesPolandPortugalPost-demographic dividendPre-demographic dividendPuerto RicoQatarRomaniaRussian FederationRwandaSamoaSan MarinoSao Tome and PrincipeSaudi ArabiaSenegalSerbiaSeychellesSierra LeoneSingaporeSint Maarten (Dutch part)Slovak RepublicSloveniaSmall statesSolomon IslandsSomaliaSouth AfricaSouth AsiaSouth Asia (IDA & IBRD)South SudanSpainSri LankaSt. Kitts and NevisSt. LuciaSt. Martin (French part)St. Vincent and the GrenadinesSub-Saharan Africa Sub-Saharan Africa (excluding high income)Sub-Saharan Africa (IDA & IBRD countries)SudanSurinameSwazilandSwedenSwitzerlandSyrian Arab RepublicTajikistanTanzaniaThailandTimor-LesteTogoTongaTrinidad and TobagoTunisiaTurkeyTurkmenistanTurks and Caicos IslandsTuvaluUgandaUkraineUnited Arab EmiratesUnited KingdomUnited StatesUpper middle incomeUruguayUzbekistanVanuatuVenezuela, RBVietnamVirgin Islands (U.S.)West Bank and GazaWorldYemen, Rep.ZambiaZimbabwe Timeline:
This timeline shows a graph from 1961 to 2016 of Niger. No data until 1960. Number of actual observations by date: 56.
Source name:
World Development Indicators
Source organization:
Derived from total population. Population source: (1) United Nations Population Division. World Population Prospects, (2) United Nations Statistical Division. Population and Vital Statistics Report (various years), (3) Census reports and other statistical
Categories, topics:
Climate Change, Health
Last updated:
apr 23, 2017
Indicators value changes by year
At the date of observation
Value
Absolute change
Change from previous value
jan 1, 1961
2.798
+2.798
0.0%
jan 1, 1962
2.858
+0.06
2.13%
jan 1, 1963
2.905
+0.047
1.65%
jan 1, 1964
2.919
+0.014
0.5%
jan 1, 1965
2.892
-0.027
-0.94%
jan 1, 1966
2.839
-0.053
-1.83%
jan 1, 1967
2.782
-0.057
-2.01%
jan 1, 1968
2.74
-0.042
-1.49%
jan 1, 1969
2.718
-0.023
-0.83%
jan 1, 1970
2.72
+0.002
0.08%
jan 1, 1971
2.739
+0.019
0.7%
jan 1, 1972
2.758
+0.019
0.69%
jan 1, 1973
2.772
+0.014
0.5%
jan 1, 1974
2.789
+0.017
0.62%
jan 1, 1975
2.809
+0.02
0.73%
jan 1, 1976
2.83
+0.02
0.73%
jan 1, 1977
2.856
+0.027
0.94%
jan 1, 1978
2.878
+0.021
0.74%
jan 1, 1979
2.875
-0.002
-0.08%
jan 1, 1980
2.845
-0.031
-1.07%
jan 1, 1981
2.799
-0.046
-1.62%
jan 1, 1982
2.756
-0.043
-1.54%
jan 1, 1983
2.729
-0.027
-0.97%
jan 1, 1984
2.719
-0.01
-0.36%
jan 1, 1985
2.73
+0.011
0.4%
jan 1, 1986
2.759
+0.029
1.05%
jan 1, 1987
2.79
+0.032
1.16%
jan 1, 1988
2.83
+0.039
1.4%
jan 1, 1989
2.893
+0.063
2.23%
jan 1, 1990
2.983
+0.09
3.11%
jan 1, 1991
3.089
+0.106
3.55%
jan 1, 1992
3.196
+0.107
3.47%
jan 1, 1993
3.293
+0.097
3.04%
jan 1, 1994
3.379
+0.086
2.62%
jan 1, 1995
3.451
+0.071
2.11%
jan 1, 1996
3.509
+0.058
1.69%
jan 1, 1997
3.565
+0.056
1.61%
jan 1, 1998
3.616
+0.05
1.42%
jan 1, 1999
3.648
+0.032
0.88%
jan 1, 2000
3.659
+0.011
0.3%
jan 1, 2001
3.657
-0.002
-0.04%
jan 1, 2002
3.654
-0.003
-0.07%
jan 1, 2003
3.657
+0.003
0.08%
jan 1, 2004
3.665
+0.007
0.2%
jan 1, 2005
3.678
+0.013
0.36%
jan 1, 2006
3.697
+0.019
0.52%
jan 1, 2007
3.713
+0.016
0.43%
jan 1, 2008
3.731
+0.019
0.5%
jan 1, 2009
3.766
+0.034
0.92%
jan 1, 2010
3.818
+0.052
1.38%
jan 1, 2011
3.879
+0.061
1.59%
jan 1, 2012
3.939
+0.06
1.55%
jan 1, 2013
3.987
+0.048
1.23%
jan 1, 2014
4.018
+0.031
0.79%
jan 1, 2015
4.029
+0.011
0.28%
jan 1, 2016
4.027
-0.003
-0.06%
Ranking of countries by current statistics by years


Comments: