29
/
en
AIzaSyAYiBZKx7MnpbEhh9jyipgxe19OcubqV5w
April 1, 2024
86401
Bhutan
BTN
true
2
1
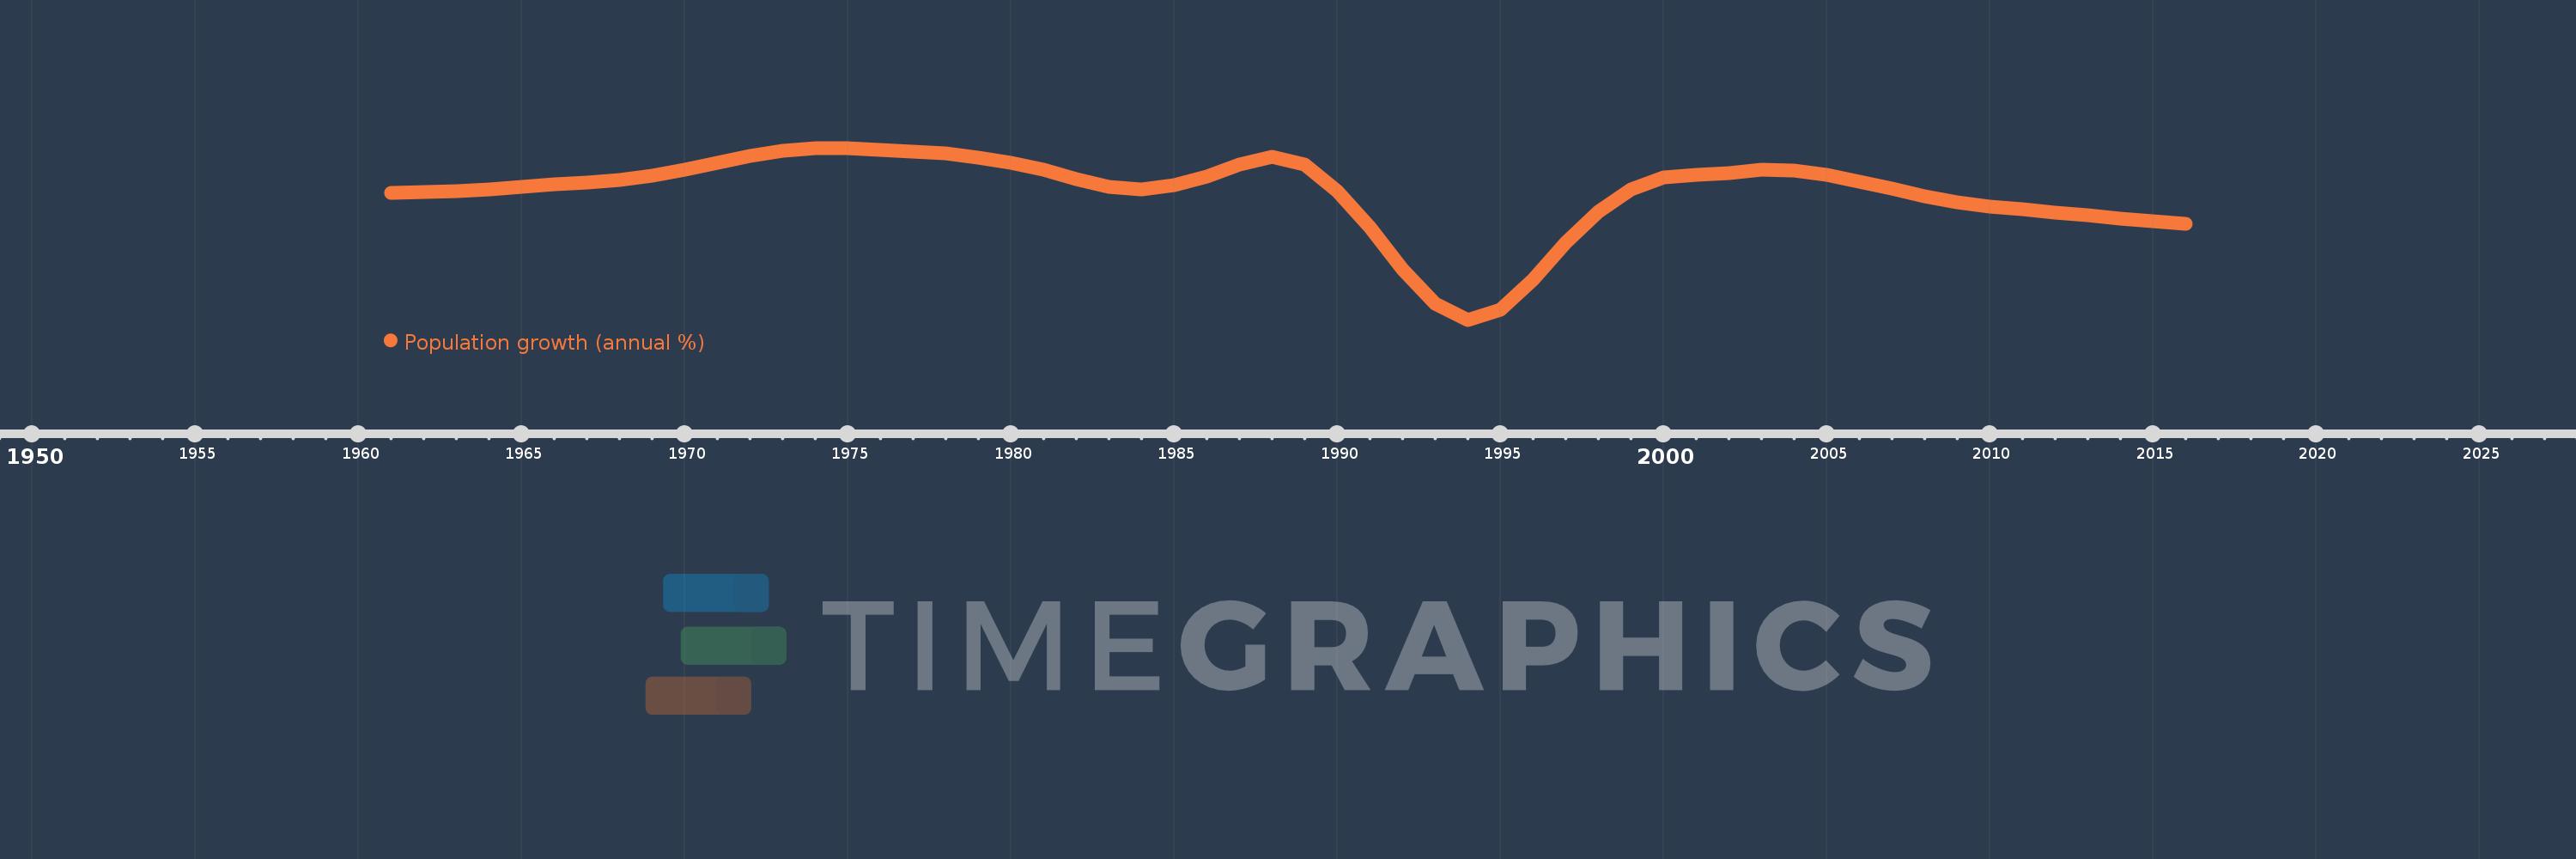
Population growth (annual %)
2016,2015,2014,2013,2012,2011,2010,2009,2008,2007,2006,2005,2004,2003,2002,2001,2000,1999,1998,1997,1996,1995,1994,1993,1992,1991,1990,1989,1988,1987,1986,1985,1984,1983,1982,1981,1980,1979,1978,1977,1976,1975,1974,1973,1972,1971,1970,1969,1968,1967,1966,1965,1964,1963,1962,1961
This statistics in other country:
AfghanistanAlbaniaAlgeriaAmerican SamoaAndorraAngolaAntigua and BarbudaArab WorldArgentinaArmeniaArubaAustraliaAustriaAzerbaijanBahamas, TheBahrainBangladeshBarbadosBelarusBelgiumBelizeBeninBermudaBhutanBoliviaBosnia and HerzegovinaBotswanaBrazilBritish Virgin IslandsBrunei DarussalamBulgariaBurkina FasoBurundiCabo VerdeCambodiaCameroonCanadaCaribbean small statesCayman IslandsCentral African RepublicCentral Europe and the BalticsChadChannel IslandsChileChinaColombiaComorosCongo, Dem. Rep.Congo, Rep.Costa RicaCote d'IvoireCroatiaCubaCuracaoCyprusCzech RepublicDenmarkDjiboutiDominicaDominican RepublicEarly-demographic dividendEast Asia & PacificEast Asia & Pacific (excluding high income)East Asia & Pacific (IDA & IBRD countries)EcuadorEgypt, Arab Rep.El SalvadorEquatorial GuineaEritreaEstoniaEthiopiaEuro areaEurope & Central AsiaEurope & Central Asia (excluding high income)Europe & Central Asia (IDA & IBRD countries)European UnionFaroe IslandsFijiFinlandFragile and conflict affected situationsFranceFrench PolynesiaGabonGambia, TheGeorgiaGermanyGhanaGibraltarGreeceGreenlandGrenadaGuamGuatemalaGuineaGuinea-BissauGuyanaHaitiHeavily indebted poor countries (HIPC)High incomeHondurasHong Kong SAR, ChinaHungaryIBRD onlyIcelandIDA & IBRD totalIDA blendIDA onlyIDA totalIndiaIndonesiaIran, Islamic Rep.IraqIrelandIsle of ManIsraelItalyJamaicaJapanJordanKazakhstanKenyaKiribatiKorea, Dem. People’s Rep.Korea, Rep.KosovoKuwaitKyrgyz RepublicLao PDRLate-demographic dividendLatin America & Caribbean Latin America & Caribbean (excluding high income)Latin America & the Caribbean (IDA & IBRD countries)LatviaLeast developed countries: UN classificationLebanonLesothoLiberiaLibyaLiechtensteinLithuaniaLow & middle incomeLow incomeLower middle incomeLuxembourgMacao SAR, ChinaMacedonia, FYRMadagascarMalawiMalaysiaMaldivesMaliMaltaMarshall IslandsMauritaniaMauritiusMexicoMicronesia, Fed. Sts.Middle East & North AfricaMiddle East & North Africa (excluding high income)Middle East & North Africa (IDA & IBRD countries)Middle incomeMoldovaMonacoMongoliaMontenegroMoroccoMozambiqueMyanmarNamibiaNauruNepalNetherlandsNew CaledoniaNew ZealandNicaraguaNigerNigeriaNorth AmericaNorthern Mariana IslandsNorwayOECD membersOmanOther small statesPacific island small statesPakistanPalauPanamaPapua New GuineaParaguayPeruPhilippinesPolandPortugalPost-demographic dividendPre-demographic dividendPuerto RicoQatarRomaniaRussian FederationRwandaSamoaSan MarinoSao Tome and PrincipeSaudi ArabiaSenegalSerbiaSeychellesSierra LeoneSingaporeSint Maarten (Dutch part)Slovak RepublicSloveniaSmall statesSolomon IslandsSomaliaSouth AfricaSouth AsiaSouth Asia (IDA & IBRD)South SudanSpainSri LankaSt. Kitts and NevisSt. LuciaSt. Martin (French part)St. Vincent and the GrenadinesSub-Saharan Africa Sub-Saharan Africa (excluding high income)Sub-Saharan Africa (IDA & IBRD countries)SudanSurinameSwazilandSwedenSwitzerlandSyrian Arab RepublicTajikistanTanzaniaThailandTimor-LesteTogoTongaTrinidad and TobagoTunisiaTurkeyTurkmenistanTurks and Caicos IslandsTuvaluUgandaUkraineUnited Arab EmiratesUnited KingdomUnited StatesUpper middle incomeUruguayUzbekistanVanuatuVenezuela, RBVietnamVirgin Islands (U.S.)West Bank and GazaWorldYemen, Rep.ZambiaZimbabwe Timeline:
This timeline shows a graph from 1961 to 2016 of Bhutan. No data until 1960. Number of actual observations by date: 56.
Source name:
World Development Indicators
Source organization:
Derived from total population. Population source: (1) United Nations Population Division. World Population Prospects, (2) United Nations Statistical Division. Population and Vital Statistics Report (various years), (3) Census reports and other statistical
Categories, topics:
Climate Change, Health
Last updated:
apr 23, 2017
Indicators value changes by year
Minimum:
-1.765
jan 1, 1994
At the date of observation
Value
Absolute change
Change from previous value
jan 1, 1961
2.262
+2.262
0.0%
jan 1, 1962
2.289
+0.027
1.18%
jan 1, 1963
2.33
+0.041
1.8%
jan 1, 1964
2.383
+0.053
2.28%
jan 1, 1965
2.449
+0.066
2.77%
jan 1, 1966
2.527
+0.078
3.19%
jan 1, 1967
2.595
+0.067
2.67%
jan 1, 1968
2.673
+0.078
3.0%
jan 1, 1969
2.805
+0.132
4.95%
jan 1, 1970
3.001
+0.196
6.97%
jan 1, 1971
3.224
+0.224
7.45%
jan 1, 1972
3.438
+0.214
6.65%
jan 1, 1973
3.601
+0.162
4.71%
jan 1, 1974
3.69
+0.089
2.47%
jan 1, 1975
3.695
+0.005
0.14%
jan 1, 1976
3.637
-0.058
-1.57%
jan 1, 1977
3.577
-0.059
-1.63%
jan 1, 1978
3.513
-0.064
-1.79%
jan 1, 1979
3.392
-0.122
-3.46%
jan 1, 1980
3.21
-0.182
-5.36%
jan 1, 1981
2.997
-0.212
-6.61%
jan 1, 1982
2.708
-0.289
-9.65%
jan 1, 1983
2.446
-0.262
-9.67%
jan 1, 1984
2.367
-0.08
-3.25%
jan 1, 1985
2.519
+0.152
6.42%
jan 1, 1986
2.784
+0.265
10.51%
jan 1, 1987
3.177
+0.394
14.15%
jan 1, 1988
3.411
+0.234
7.37%
jan 1, 1989
3.166
-0.245
-7.18%
jan 1, 1990
2.335
-0.831
-26.25%
jan 1, 1991
1.169
-1.167
-49.96%
jan 1, 1992
-0.155
-1.323
-113.23%
jan 1, 1993
-1.241
-1.086
702.8%
jan 1, 1994
-1.765
-0.524
42.24%
jan 1, 1995
-1.449
+0.316
-17.88%
jan 1, 1996
-0.487
+0.962
-66.39%
jan 1, 1997
0.682
+1.169
-239.9%
jan 1, 1998
1.653
+0.971
142.55%
jan 1, 1999
2.388
+0.735
44.46%
jan 1, 2000
2.751
+0.363
15.21%
jan 1, 2001
2.84
+0.089
3.25%
jan 1, 2002
2.899
+0.059
2.07%
jan 1, 2003
2.992
+0.092
3.18%
jan 1, 2004
2.972
-0.019
-0.65%
jan 1, 2005
2.84
-0.132
-4.44%
jan 1, 2006
2.634
-0.206
-7.26%
jan 1, 2007
2.391
-0.243
-9.23%
jan 1, 2008
2.158
-0.233
-9.73%
jan 1, 2009
1.964
-0.194
-8.99%
jan 1, 2010
1.831
-0.134
-6.81%
jan 1, 2011
1.739
-0.092
-5.01%
jan 1, 2012
1.652
-0.087
-4.98%
jan 1, 2013
1.554
-0.099
-5.98%
jan 1, 2014
1.458
-0.095
-6.13%
jan 1, 2015
1.365
-0.093
-6.41%
jan 1, 2016
1.276
-0.089
-6.54%
Ranking of countries by current statistics by years


Comments: