29
/
en
AIzaSyAYiBZKx7MnpbEhh9jyipgxe19OcubqV5w
April 1, 2024
101968
Cayman Islands
CYM
true
2
1
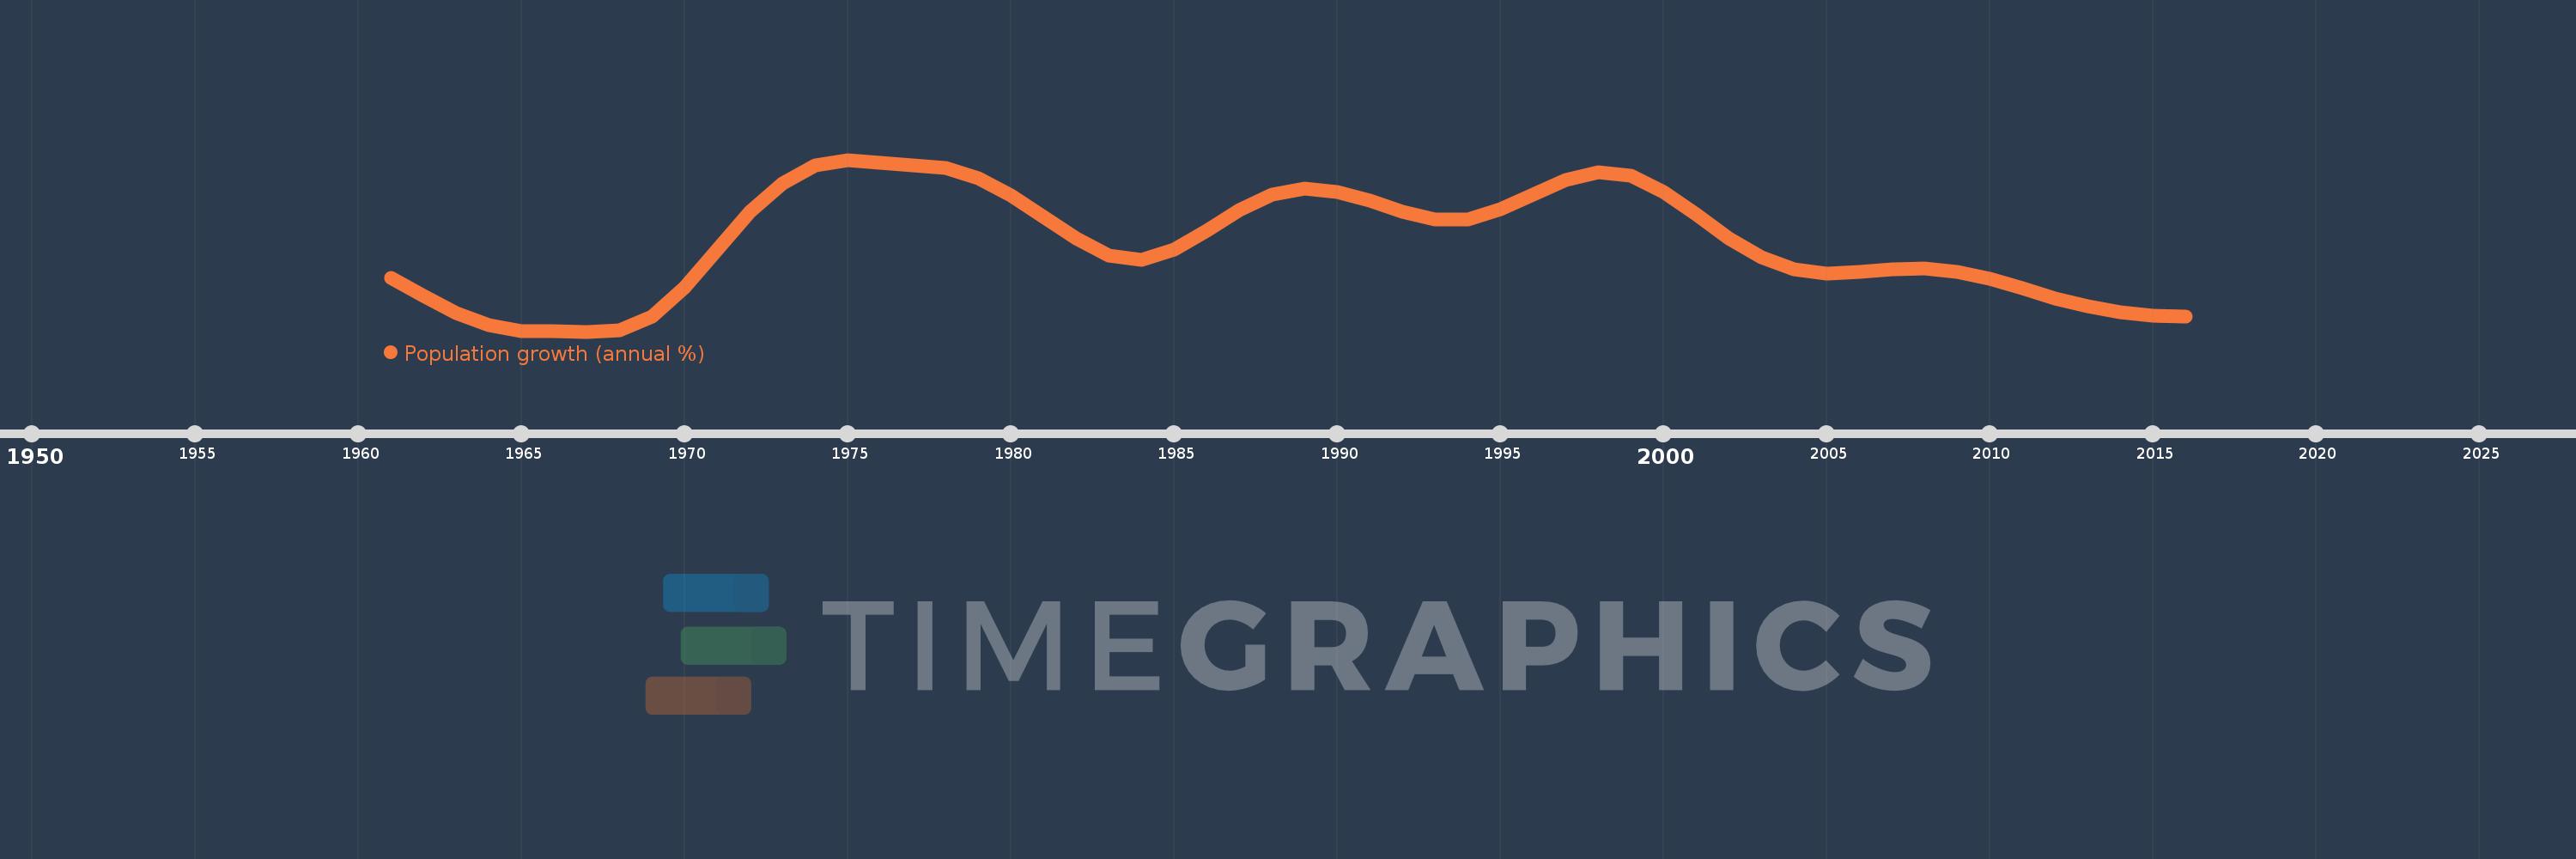
Population growth (annual %)
2016,2015,2014,2013,2012,2011,2010,2009,2008,2007,2006,2005,2004,2003,2002,2001,2000,1999,1998,1997,1996,1995,1994,1993,1992,1991,1990,1989,1988,1987,1986,1985,1984,1983,1982,1981,1980,1979,1978,1977,1976,1975,1974,1973,1972,1971,1970,1969,1968,1967,1966,1965,1964,1963,1962,1961
This statistics in other country:
AfghanistanAlbaniaAlgeriaAmerican SamoaAndorraAngolaAntigua and BarbudaArab WorldArgentinaArmeniaArubaAustraliaAustriaAzerbaijanBahamas, TheBahrainBangladeshBarbadosBelarusBelgiumBelizeBeninBermudaBhutanBoliviaBosnia and HerzegovinaBotswanaBrazilBritish Virgin IslandsBrunei DarussalamBulgariaBurkina FasoBurundiCabo VerdeCambodiaCameroonCanadaCaribbean small statesCayman IslandsCentral African RepublicCentral Europe and the BalticsChadChannel IslandsChileChinaColombiaComorosCongo, Dem. Rep.Congo, Rep.Costa RicaCote d'IvoireCroatiaCubaCuracaoCyprusCzech RepublicDenmarkDjiboutiDominicaDominican RepublicEarly-demographic dividendEast Asia & PacificEast Asia & Pacific (excluding high income)East Asia & Pacific (IDA & IBRD countries)EcuadorEgypt, Arab Rep.El SalvadorEquatorial GuineaEritreaEstoniaEthiopiaEuro areaEurope & Central AsiaEurope & Central Asia (excluding high income)Europe & Central Asia (IDA & IBRD countries)European UnionFaroe IslandsFijiFinlandFragile and conflict affected situationsFranceFrench PolynesiaGabonGambia, TheGeorgiaGermanyGhanaGibraltarGreeceGreenlandGrenadaGuamGuatemalaGuineaGuinea-BissauGuyanaHaitiHeavily indebted poor countries (HIPC)High incomeHondurasHong Kong SAR, ChinaHungaryIBRD onlyIcelandIDA & IBRD totalIDA blendIDA onlyIDA totalIndiaIndonesiaIran, Islamic Rep.IraqIrelandIsle of ManIsraelItalyJamaicaJapanJordanKazakhstanKenyaKiribatiKorea, Dem. People’s Rep.Korea, Rep.KosovoKuwaitKyrgyz RepublicLao PDRLate-demographic dividendLatin America & Caribbean Latin America & Caribbean (excluding high income)Latin America & the Caribbean (IDA & IBRD countries)LatviaLeast developed countries: UN classificationLebanonLesothoLiberiaLibyaLiechtensteinLithuaniaLow & middle incomeLow incomeLower middle incomeLuxembourgMacao SAR, ChinaMacedonia, FYRMadagascarMalawiMalaysiaMaldivesMaliMaltaMarshall IslandsMauritaniaMauritiusMexicoMicronesia, Fed. Sts.Middle East & North AfricaMiddle East & North Africa (excluding high income)Middle East & North Africa (IDA & IBRD countries)Middle incomeMoldovaMonacoMongoliaMontenegroMoroccoMozambiqueMyanmarNamibiaNauruNepalNetherlandsNew CaledoniaNew ZealandNicaraguaNigerNigeriaNorth AmericaNorthern Mariana IslandsNorwayOECD membersOmanOther small statesPacific island small statesPakistanPalauPanamaPapua New GuineaParaguayPeruPhilippinesPolandPortugalPost-demographic dividendPre-demographic dividendPuerto RicoQatarRomaniaRussian FederationRwandaSamoaSan MarinoSao Tome and PrincipeSaudi ArabiaSenegalSerbiaSeychellesSierra LeoneSingaporeSint Maarten (Dutch part)Slovak RepublicSloveniaSmall statesSolomon IslandsSomaliaSouth AfricaSouth AsiaSouth Asia (IDA & IBRD)South SudanSpainSri LankaSt. Kitts and NevisSt. LuciaSt. Martin (French part)St. Vincent and the GrenadinesSub-Saharan Africa Sub-Saharan Africa (excluding high income)Sub-Saharan Africa (IDA & IBRD countries)SudanSurinameSwazilandSwedenSwitzerlandSyrian Arab RepublicTajikistanTanzaniaThailandTimor-LesteTogoTongaTrinidad and TobagoTunisiaTurkeyTurkmenistanTurks and Caicos IslandsTuvaluUgandaUkraineUnited Arab EmiratesUnited KingdomUnited StatesUpper middle incomeUruguayUzbekistanVanuatuVenezuela, RBVietnamVirgin Islands (U.S.)West Bank and GazaWorldYemen, Rep.ZambiaZimbabwe Timeline:
This timeline shows a graph from 1961 to 2016 of Cayman Islands. No data until 1960. Number of actual observations by date: 56.
Source name:
World Development Indicators
Source organization:
Derived from total population. Population source: (1) United Nations Population Division. World Population Prospects, (2) United Nations Statistical Division. Population and Vital Statistics Report (various years), (3) Census reports and other statistical
Categories, topics:
Climate Change, Health
Last updated:
apr 23, 2017
Indicators value changes by year
At the date of observation
Value
Absolute change
Change from previous value
jan 1, 1961
2.575
+2.575
0.0%
jan 1, 1962
2.001
-0.574
-22.3%
jan 1, 1963
1.435
-0.566
-28.29%
jan 1, 1964
1.051
-0.384
-26.78%
jan 1, 1965
0.859
-0.192
-18.23%
jan 1, 1966
0.864
+0.005
0.54%
jan 1, 1967
0.845
-0.019
-2.23%
jan 1, 1968
0.896
+0.052
6.11%
jan 1, 1969
1.329
+0.433
48.34%
jan 1, 1970
2.279
+0.95
71.44%
jan 1, 1971
3.483
+1.204
52.82%
jan 1, 1972
4.689
+1.206
34.63%
jan 1, 1973
5.62
+0.931
19.85%
jan 1, 1974
6.196
+0.576
10.25%
jan 1, 1975
6.367
+0.17
2.75%
jan 1, 1976
6.272
-0.095
-1.49%
jan 1, 1977
6.194
-0.078
-1.24%
jan 1, 1978
6.108
-0.086
-1.4%
jan 1, 1979
5.776
-0.331
-5.42%
jan 1, 1980
5.209
-0.568
-9.83%
jan 1, 1981
4.537
-0.672
-12.89%
jan 1, 1982
3.829
-0.708
-15.6%
jan 1, 1983
3.291
-0.538
-14.05%
jan 1, 1984
3.142
-0.15
-4.54%
jan 1, 1985
3.468
+0.326
10.37%
jan 1, 1986
4.079
+0.611
17.63%
jan 1, 1987
4.747
+0.668
16.38%
jan 1, 1988
5.237
+0.49
10.32%
jan 1, 1989
5.452
+0.215
4.11%
jan 1, 1990
5.343
-0.109
-2.01%
jan 1, 1991
5.056
-0.287
-5.37%
jan 1, 1992
4.694
-0.362
-7.15%
jan 1, 1993
4.444
-0.251
-5.34%
jan 1, 1994
4.461
+0.017
0.38%
jan 1, 1995
4.781
+0.32
7.17%
jan 1, 1996
5.24
+0.46
9.62%
jan 1, 1997
5.716
+0.475
9.07%
jan 1, 1998
5.964
+0.249
4.35%
jan 1, 1999
5.854
-0.11
-1.85%
jan 1, 2000
5.334
-0.52
-8.88%
jan 1, 2001
4.602
-0.732
-13.72%
jan 1, 2002
3.84
-0.762
-16.56%
jan 1, 2003
3.237
-0.604
-15.72%
jan 1, 2004
2.842
-0.394
-12.18%
jan 1, 2005
2.715
-0.127
-4.47%
jan 1, 2006
2.761
+0.046
1.68%
jan 1, 2007
2.849
+0.088
3.18%
jan 1, 2008
2.861
+0.012
0.44%
jan 1, 2009
2.768
-0.093
-3.24%
jan 1, 2010
2.537
-0.231
-8.35%
jan 1, 2011
2.23
-0.307
-12.12%
jan 1, 2012
1.911
-0.319
-14.29%
jan 1, 2013
1.651
-0.26
-13.6%
jan 1, 2014
1.462
-0.189
-11.47%
jan 1, 2015
1.366
-0.095
-6.53%
jan 1, 2016
1.335
-0.032
-2.32%
Ranking of countries by current statistics by years


Comments: