29
/
en
AIzaSyAYiBZKx7MnpbEhh9jyipgxe19OcubqV5w
April 1, 2024
118318
Czech Republic
CZE
true
2
1
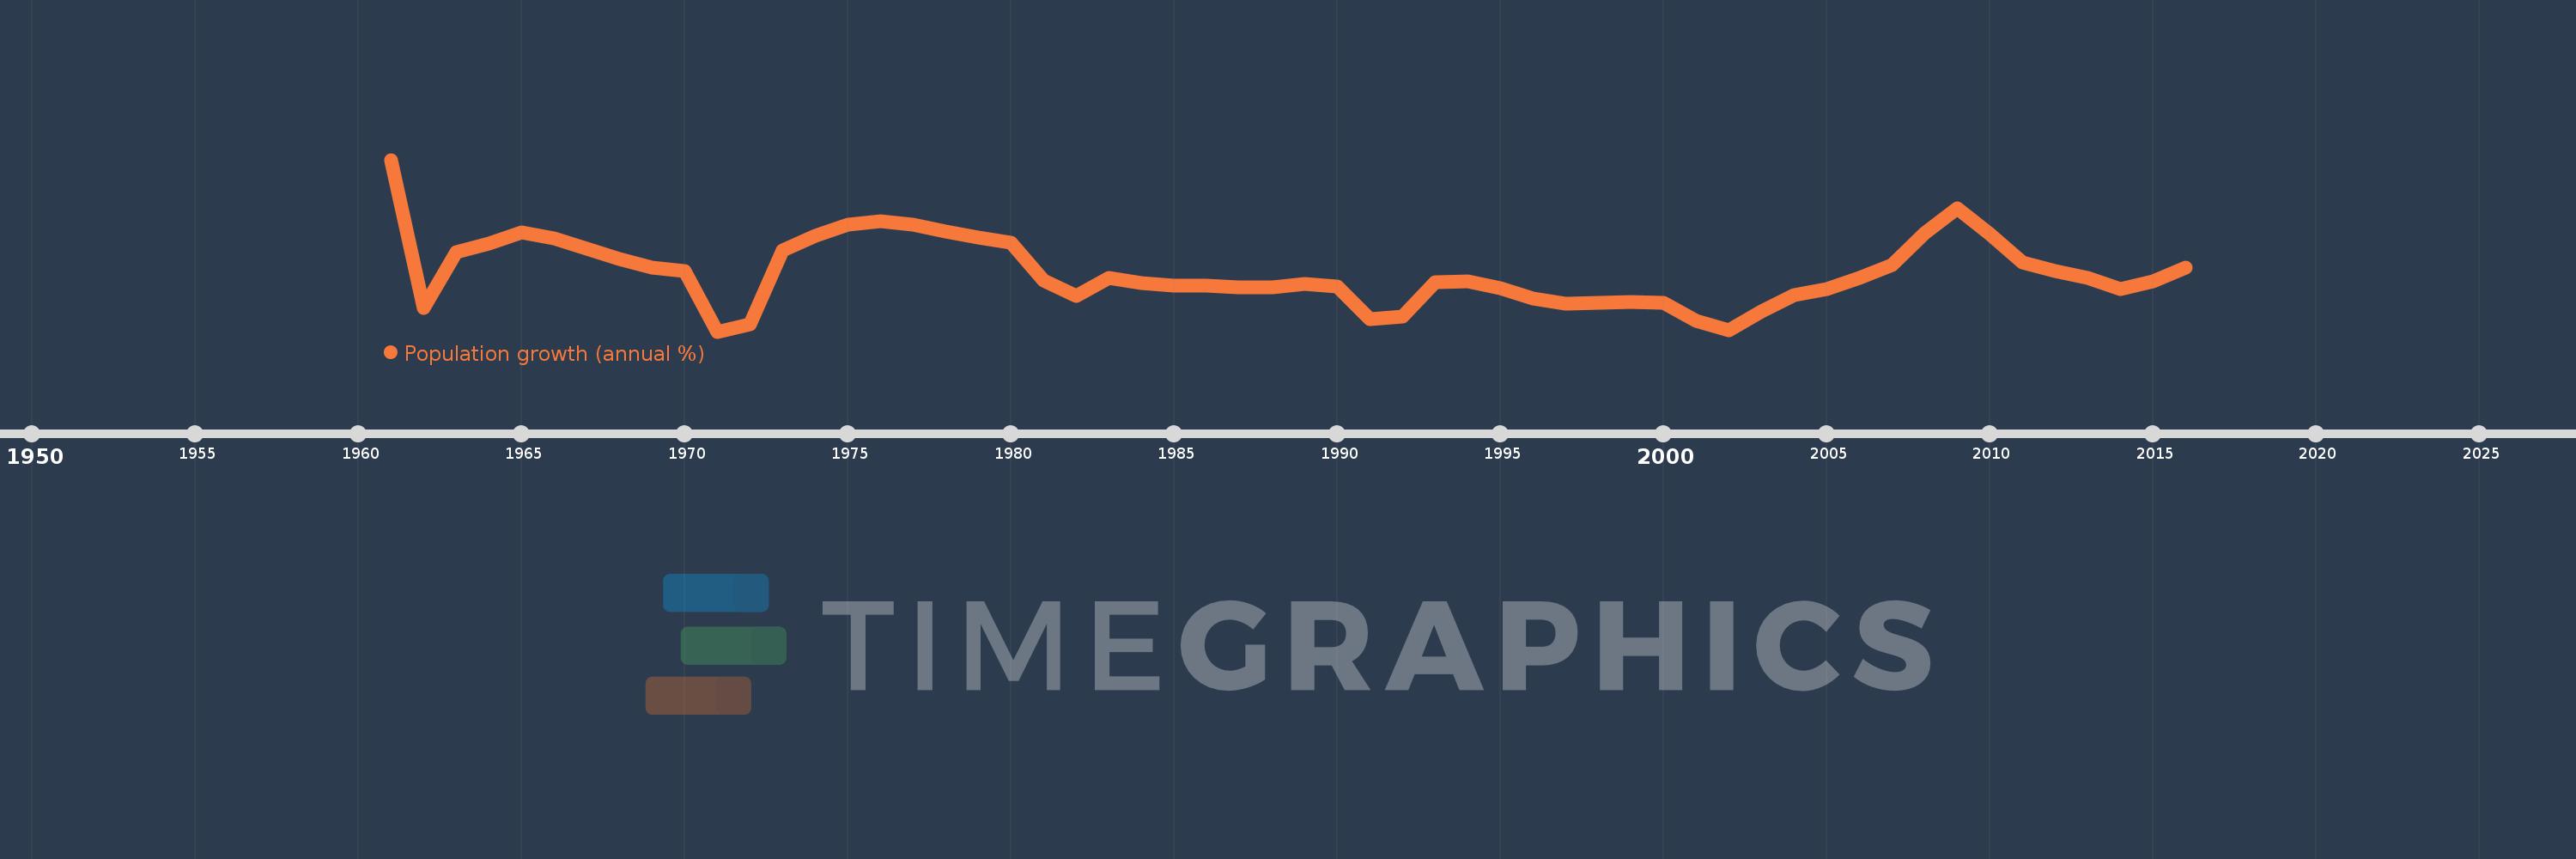
Population growth (annual %)
2016,2015,2014,2013,2012,2011,2010,2009,2008,2007,2006,2005,2004,2003,2002,2001,2000,1999,1998,1997,1996,1995,1994,1993,1992,1991,1990,1989,1988,1987,1986,1985,1984,1983,1982,1981,1980,1979,1978,1977,1976,1975,1974,1973,1972,1971,1970,1969,1968,1967,1966,1965,1964,1963,1962,1961
This statistics in other country:
AfghanistanAlbaniaAlgeriaAmerican SamoaAndorraAngolaAntigua and BarbudaArab WorldArgentinaArmeniaArubaAustraliaAustriaAzerbaijanBahamas, TheBahrainBangladeshBarbadosBelarusBelgiumBelizeBeninBermudaBhutanBoliviaBosnia and HerzegovinaBotswanaBrazilBritish Virgin IslandsBrunei DarussalamBulgariaBurkina FasoBurundiCabo VerdeCambodiaCameroonCanadaCaribbean small statesCayman IslandsCentral African RepublicCentral Europe and the BalticsChadChannel IslandsChileChinaColombiaComorosCongo, Dem. Rep.Congo, Rep.Costa RicaCote d'IvoireCroatiaCubaCuracaoCyprusCzech RepublicDenmarkDjiboutiDominicaDominican RepublicEarly-demographic dividendEast Asia & PacificEast Asia & Pacific (excluding high income)East Asia & Pacific (IDA & IBRD countries)EcuadorEgypt, Arab Rep.El SalvadorEquatorial GuineaEritreaEstoniaEthiopiaEuro areaEurope & Central AsiaEurope & Central Asia (excluding high income)Europe & Central Asia (IDA & IBRD countries)European UnionFaroe IslandsFijiFinlandFragile and conflict affected situationsFranceFrench PolynesiaGabonGambia, TheGeorgiaGermanyGhanaGibraltarGreeceGreenlandGrenadaGuamGuatemalaGuineaGuinea-BissauGuyanaHaitiHeavily indebted poor countries (HIPC)High incomeHondurasHong Kong SAR, ChinaHungaryIBRD onlyIcelandIDA & IBRD totalIDA blendIDA onlyIDA totalIndiaIndonesiaIran, Islamic Rep.IraqIrelandIsle of ManIsraelItalyJamaicaJapanJordanKazakhstanKenyaKiribatiKorea, Dem. People’s Rep.Korea, Rep.KosovoKuwaitKyrgyz RepublicLao PDRLate-demographic dividendLatin America & Caribbean Latin America & Caribbean (excluding high income)Latin America & the Caribbean (IDA & IBRD countries)LatviaLeast developed countries: UN classificationLebanonLesothoLiberiaLibyaLiechtensteinLithuaniaLow & middle incomeLow incomeLower middle incomeLuxembourgMacao SAR, ChinaMacedonia, FYRMadagascarMalawiMalaysiaMaldivesMaliMaltaMarshall IslandsMauritaniaMauritiusMexicoMicronesia, Fed. Sts.Middle East & North AfricaMiddle East & North Africa (excluding high income)Middle East & North Africa (IDA & IBRD countries)Middle incomeMoldovaMonacoMongoliaMontenegroMoroccoMozambiqueMyanmarNamibiaNauruNepalNetherlandsNew CaledoniaNew ZealandNicaraguaNigerNigeriaNorth AmericaNorthern Mariana IslandsNorwayOECD membersOmanOther small statesPacific island small statesPakistanPalauPanamaPapua New GuineaParaguayPeruPhilippinesPolandPortugalPost-demographic dividendPre-demographic dividendPuerto RicoQatarRomaniaRussian FederationRwandaSamoaSan MarinoSao Tome and PrincipeSaudi ArabiaSenegalSerbiaSeychellesSierra LeoneSingaporeSint Maarten (Dutch part)Slovak RepublicSloveniaSmall statesSolomon IslandsSomaliaSouth AfricaSouth AsiaSouth Asia (IDA & IBRD)South SudanSpainSri LankaSt. Kitts and NevisSt. LuciaSt. Martin (French part)St. Vincent and the GrenadinesSub-Saharan Africa Sub-Saharan Africa (excluding high income)Sub-Saharan Africa (IDA & IBRD countries)SudanSurinameSwazilandSwedenSwitzerlandSyrian Arab RepublicTajikistanTanzaniaThailandTimor-LesteTogoTongaTrinidad and TobagoTunisiaTurkeyTurkmenistanTurks and Caicos IslandsTuvaluUgandaUkraineUnited Arab EmiratesUnited KingdomUnited StatesUpper middle incomeUruguayUzbekistanVanuatuVenezuela, RBVietnamVirgin Islands (U.S.)West Bank and GazaWorldYemen, Rep.ZambiaZimbabwe Timeline:
This timeline shows a graph from 1961 to 2016 of Czech Republic. No data until 1960. Number of actual observations by date: 56.
Source name:
World Development Indicators
Source organization:
Derived from total population. Population source: (1) United Nations Population Division. World Population Prospects, (2) United Nations Statistical Division. Population and Vital Statistics Report (various years), (3) Census reports and other statistical
Categories, topics:
Climate Change, Health
Last updated:
apr 23, 2017
Indicators value changes by year
At the date of observation
Value
Absolute change
Change from previous value
jan 1, 1961
1.307
+1.307
0.0%
jan 1, 1962
-0.16
-1.467
-112.25%
jan 1, 1963
0.396
+0.556
-347.24%
jan 1, 1964
0.477
+0.081
20.56%
jan 1, 1965
0.589
+0.112
23.44%
jan 1, 1966
0.529
-0.06
-10.25%
jan 1, 1967
0.425
-0.103
-19.53%
jan 1, 1968
0.324
-0.101
-23.85%
jan 1, 1969
0.238
-0.086
-26.61%
jan 1, 1970
0.205
-0.033
-13.89%
jan 1, 1971
-0.39
-0.595
-290.49%
jan 1, 1972
-0.318
+0.072
-18.55%
jan 1, 1973
0.415
+0.732
-230.53%
jan 1, 1974
0.552
+0.138
33.21%
jan 1, 1975
0.665
+0.113
20.42%
jan 1, 1976
0.7
+0.035
5.27%
jan 1, 1977
0.667
-0.033
-4.7%
jan 1, 1978
0.599
-0.068
-10.23%
jan 1, 1979
0.542
-0.057
-9.52%
jan 1, 1980
0.489
-0.052
-9.68%
jan 1, 1981
0.115
-0.374
-76.48%
jan 1, 1982
-0.035
-0.15
-130.38%
jan 1, 1983
0.138
+0.173
-494.99%
jan 1, 1984
0.088
-0.051
-36.64%
jan 1, 1985
0.062
-0.026
-29.65%
jan 1, 1986
0.067
+0.005
8.55%
jan 1, 1987
0.049
-0.017
-26.05%
jan 1, 1988
0.049
0.0
-0.4%
jan 1, 1989
0.077
+0.028
56.22%
jan 1, 1990
0.056
-0.021
-27.27%
jan 1, 1991
-0.268
-0.324
-578.98%
jan 1, 1992
-0.24
+0.028
-10.37%
jan 1, 1993
0.102
+0.342
-142.59%
jan 1, 1994
0.104
+0.002
1.67%
jan 1, 1995
0.036
-0.068
-65.25%
jan 1, 1996
-0.061
-0.097
-269.74%
jan 1, 1997
-0.116
-0.055
89.81%
jan 1, 1998
-0.108
+0.009
-7.41%
jan 1, 1999
-0.095
+0.013
-12.08%
jan 1, 2000
-0.102
-0.007
7.84%
jan 1, 2001
-0.28
-0.178
174.44%
jan 1, 2002
-0.376
-0.095
33.99%
jan 1, 2003
-0.193
+0.183
-48.66%
jan 1, 2004
-0.029
+0.164
-85.16%
jan 1, 2005
0.03
+0.059
-206.34%
jan 1, 2006
0.138
+0.108
354.5%
jan 1, 2007
0.271
+0.132
95.77%
jan 1, 2008
0.584
+0.313
115.49%
jan 1, 2009
0.829
+0.246
42.13%
jan 1, 2010
0.57
-0.26
-31.31%
jan 1, 2011
0.291
-0.278
-48.86%
jan 1, 2012
0.207
-0.085
-29.04%
jan 1, 2013
0.14
-0.067
-32.32%
jan 1, 2014
0.033
-0.107
-76.29%
jan 1, 2015
0.105
+0.072
217.39%
jan 1, 2016
0.246
+0.14
133.2%
Ranking of countries by current statistics by years


Comments: