29
/
en
AIzaSyAYiBZKx7MnpbEhh9jyipgxe19OcubqV5w
April 1, 2024
182462
Luxembourg
LUX
true
2
1
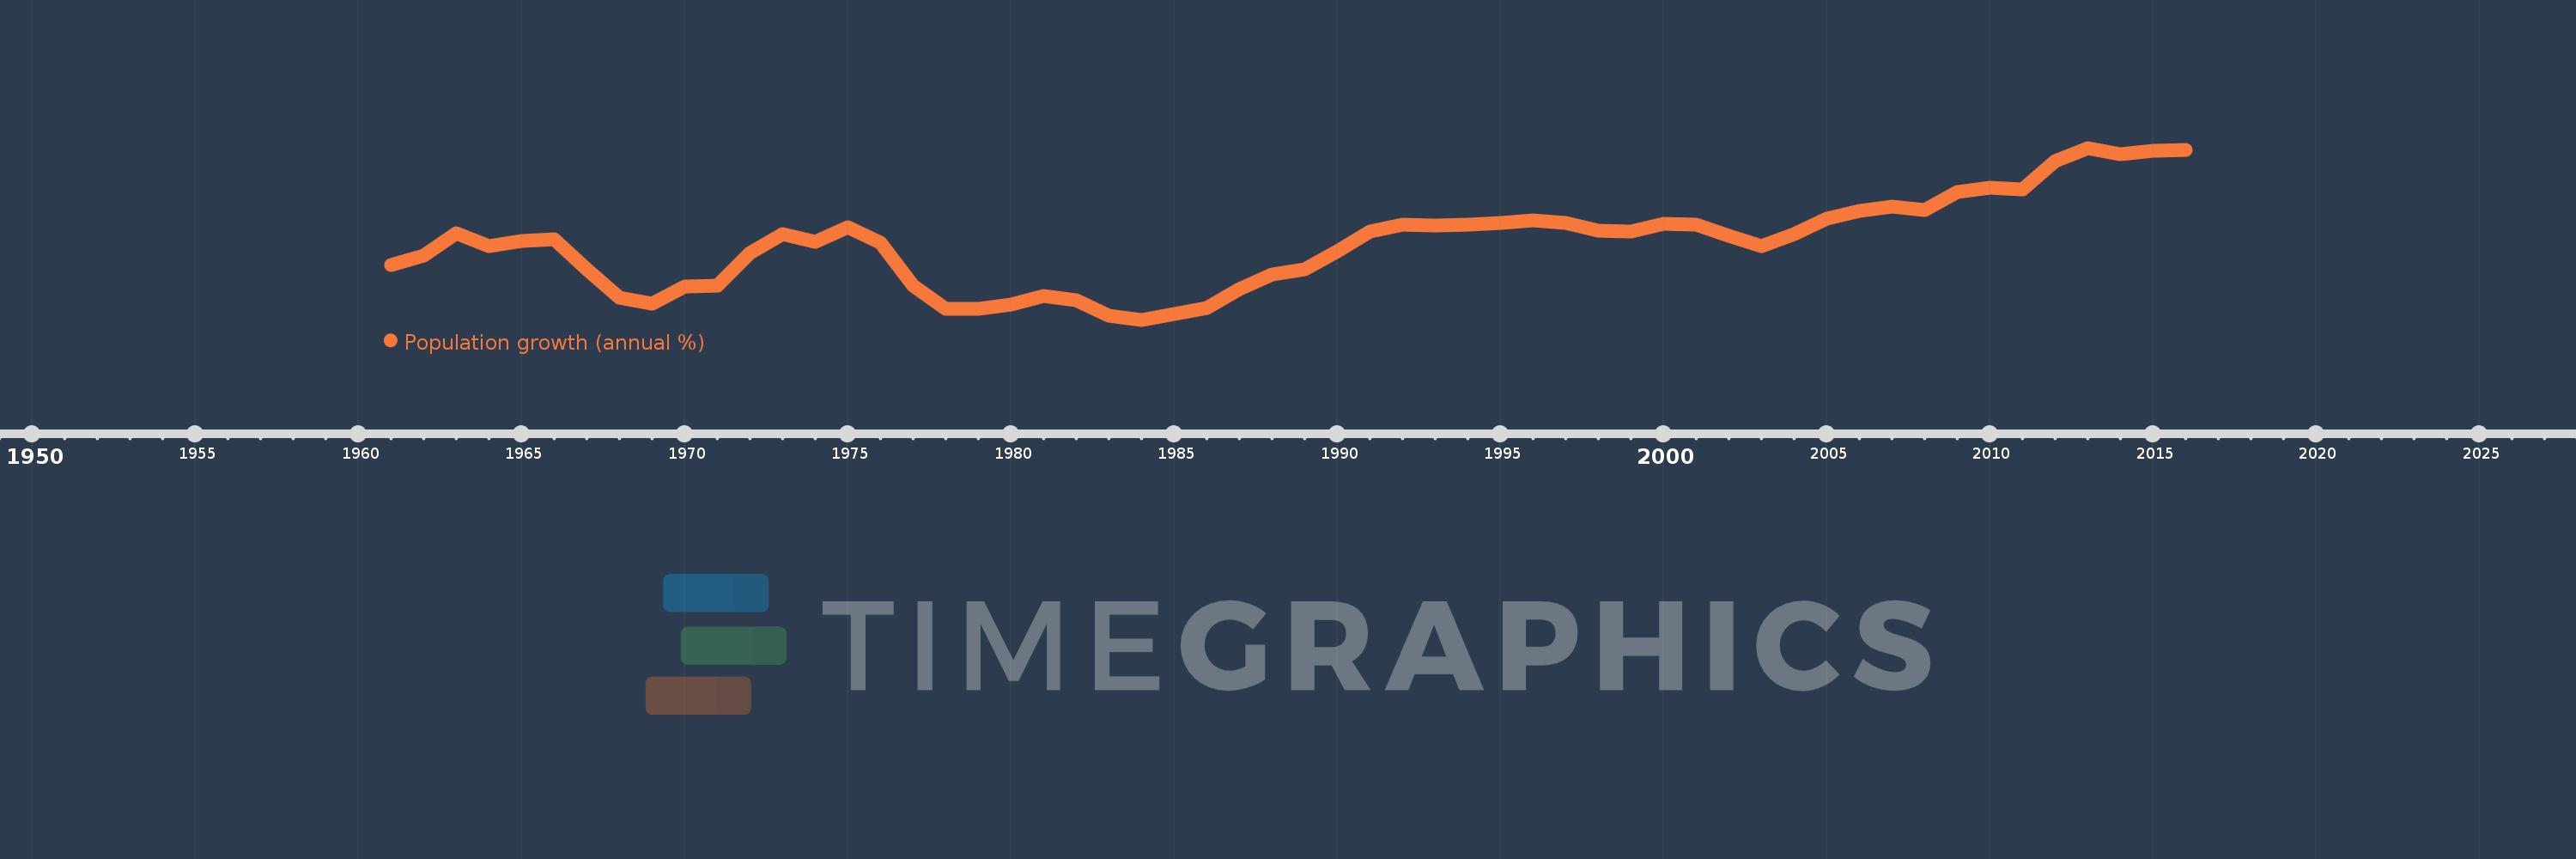
Population growth (annual %)
2016,2015,2014,2013,2012,2011,2010,2009,2008,2007,2006,2005,2004,2003,2002,2001,2000,1999,1998,1997,1996,1995,1994,1993,1992,1991,1990,1989,1988,1987,1986,1985,1984,1983,1982,1981,1980,1979,1978,1977,1976,1975,1974,1973,1972,1971,1970,1969,1968,1967,1966,1965,1964,1963,1962,1961
This statistics in other country:
AfghanistanAlbaniaAlgeriaAmerican SamoaAndorraAngolaAntigua and BarbudaArab WorldArgentinaArmeniaArubaAustraliaAustriaAzerbaijanBahamas, TheBahrainBangladeshBarbadosBelarusBelgiumBelizeBeninBermudaBhutanBoliviaBosnia and HerzegovinaBotswanaBrazilBritish Virgin IslandsBrunei DarussalamBulgariaBurkina FasoBurundiCabo VerdeCambodiaCameroonCanadaCaribbean small statesCayman IslandsCentral African RepublicCentral Europe and the BalticsChadChannel IslandsChileChinaColombiaComorosCongo, Dem. Rep.Congo, Rep.Costa RicaCote d'IvoireCroatiaCubaCuracaoCyprusCzech RepublicDenmarkDjiboutiDominicaDominican RepublicEarly-demographic dividendEast Asia & PacificEast Asia & Pacific (excluding high income)East Asia & Pacific (IDA & IBRD countries)EcuadorEgypt, Arab Rep.El SalvadorEquatorial GuineaEritreaEstoniaEthiopiaEuro areaEurope & Central AsiaEurope & Central Asia (excluding high income)Europe & Central Asia (IDA & IBRD countries)European UnionFaroe IslandsFijiFinlandFragile and conflict affected situationsFranceFrench PolynesiaGabonGambia, TheGeorgiaGermanyGhanaGibraltarGreeceGreenlandGrenadaGuamGuatemalaGuineaGuinea-BissauGuyanaHaitiHeavily indebted poor countries (HIPC)High incomeHondurasHong Kong SAR, ChinaHungaryIBRD onlyIcelandIDA & IBRD totalIDA blendIDA onlyIDA totalIndiaIndonesiaIran, Islamic Rep.IraqIrelandIsle of ManIsraelItalyJamaicaJapanJordanKazakhstanKenyaKiribatiKorea, Dem. People’s Rep.Korea, Rep.KosovoKuwaitKyrgyz RepublicLao PDRLate-demographic dividendLatin America & Caribbean Latin America & Caribbean (excluding high income)Latin America & the Caribbean (IDA & IBRD countries)LatviaLeast developed countries: UN classificationLebanonLesothoLiberiaLibyaLiechtensteinLithuaniaLow & middle incomeLow incomeLower middle incomeLuxembourgMacao SAR, ChinaMacedonia, FYRMadagascarMalawiMalaysiaMaldivesMaliMaltaMarshall IslandsMauritaniaMauritiusMexicoMicronesia, Fed. Sts.Middle East & North AfricaMiddle East & North Africa (excluding high income)Middle East & North Africa (IDA & IBRD countries)Middle incomeMoldovaMonacoMongoliaMontenegroMoroccoMozambiqueMyanmarNamibiaNauruNepalNetherlandsNew CaledoniaNew ZealandNicaraguaNigerNigeriaNorth AmericaNorthern Mariana IslandsNorwayOECD membersOmanOther small statesPacific island small statesPakistanPalauPanamaPapua New GuineaParaguayPeruPhilippinesPolandPortugalPost-demographic dividendPre-demographic dividendPuerto RicoQatarRomaniaRussian FederationRwandaSamoaSan MarinoSao Tome and PrincipeSaudi ArabiaSenegalSerbiaSeychellesSierra LeoneSingaporeSint Maarten (Dutch part)Slovak RepublicSloveniaSmall statesSolomon IslandsSomaliaSouth AfricaSouth AsiaSouth Asia (IDA & IBRD)South SudanSpainSri LankaSt. Kitts and NevisSt. LuciaSt. Martin (French part)St. Vincent and the GrenadinesSub-Saharan Africa Sub-Saharan Africa (excluding high income)Sub-Saharan Africa (IDA & IBRD countries)SudanSurinameSwazilandSwedenSwitzerlandSyrian Arab RepublicTajikistanTanzaniaThailandTimor-LesteTogoTongaTrinidad and TobagoTunisiaTurkeyTurkmenistanTurks and Caicos IslandsTuvaluUgandaUkraineUnited Arab EmiratesUnited KingdomUnited StatesUpper middle incomeUruguayUzbekistanVanuatuVenezuela, RBVietnamVirgin Islands (U.S.)West Bank and GazaWorldYemen, Rep.ZambiaZimbabwe Timeline:
This timeline shows a graph from 1961 to 2016 of Luxembourg. No data until 1960. Number of actual observations by date: 56.
Source name:
World Development Indicators
Source organization:
Derived from total population. Population source: (1) United Nations Population Division. World Population Prospects, (2) United Nations Statistical Division. Population and Vital Statistics Report (various years), (3) Census reports and other statistical
Categories, topics:
Climate Change, Health
Last updated:
apr 23, 2017
Indicators value changes by year
At the date of observation
Value
Absolute change
Change from previous value
jan 1, 1961
0.787
+0.787
0.0%
jan 1, 1962
0.912
+0.124
15.79%
jan 1, 1963
1.225
+0.313
34.38%
jan 1, 1964
1.039
-0.186
-15.18%
jan 1, 1965
1.12
+0.081
7.79%
jan 1, 1966
1.138
+0.018
1.59%
jan 1, 1967
0.72
-0.418
-36.72%
jan 1, 1968
0.329
-0.391
-54.31%
jan 1, 1969
0.255
-0.074
-22.5%
jan 1, 1970
0.49
+0.235
92.26%
jan 1, 1971
0.494
+0.004
0.78%
jan 1, 1972
0.954
+0.46
93.09%
jan 1, 1973
1.213
+0.259
27.2%
jan 1, 1974
1.105
-0.108
-8.93%
jan 1, 1975
1.304
+0.199
18.05%
jan 1, 1976
1.092
-0.212
-16.23%
jan 1, 1977
0.495
-0.598
-54.69%
jan 1, 1978
0.174
-0.321
-64.91%
jan 1, 1979
0.179
+0.006
3.33%
jan 1, 1980
0.234
+0.055
30.55%
jan 1, 1981
0.356
+0.122
51.97%
jan 1, 1982
0.295
-0.061
-17.19%
jan 1, 1983
0.082
-0.213
-72.15%
jan 1, 1984
0.027
-0.056
-67.68%
jan 1, 1985
0.103
+0.076
287.38%
jan 1, 1986
0.193
+0.09
88.02%
jan 1, 1987
0.449
+0.255
132.16%
jan 1, 1988
0.648
+0.199
44.45%
jan 1, 1989
0.726
+0.078
11.96%
jan 1, 1990
0.973
+0.247
34.04%
jan 1, 1991
1.252
+0.279
28.7%
jan 1, 1992
1.34
+0.088
7.03%
jan 1, 1993
1.328
-0.011
-0.85%
jan 1, 1994
1.342
+0.014
1.06%
jan 1, 1995
1.362
+0.019
1.45%
jan 1, 1996
1.405
+0.043
3.15%
jan 1, 1997
1.361
-0.044
-3.1%
jan 1, 1998
1.254
-0.108
-7.91%
jan 1, 1999
1.244
-0.01
-0.77%
jan 1, 2000
1.351
+0.107
8.58%
jan 1, 2001
1.344
-0.007
-0.48%
jan 1, 2002
1.19
-0.154
-11.43%
jan 1, 2003
1.048
-0.143
-12.0%
jan 1, 2004
1.215
+0.168
15.99%
jan 1, 2005
1.421
+0.206
16.96%
jan 1, 2006
1.53
+0.109
7.65%
jan 1, 2007
1.595
+0.065
4.25%
jan 1, 2008
1.544
-0.051
-3.18%
jan 1, 2009
1.787
+0.243
15.74%
jan 1, 2010
1.852
+0.064
3.6%
jan 1, 2011
1.825
-0.026
-1.42%
jan 1, 2012
2.223
+0.397
21.76%
jan 1, 2013
2.402
+0.179
8.05%
jan 1, 2014
2.311
-0.09
-3.76%
jan 1, 2015
2.357
+0.046
1.98%
jan 1, 2016
2.373
+0.016
0.66%
Ranking of countries by current statistics by years


Comments: